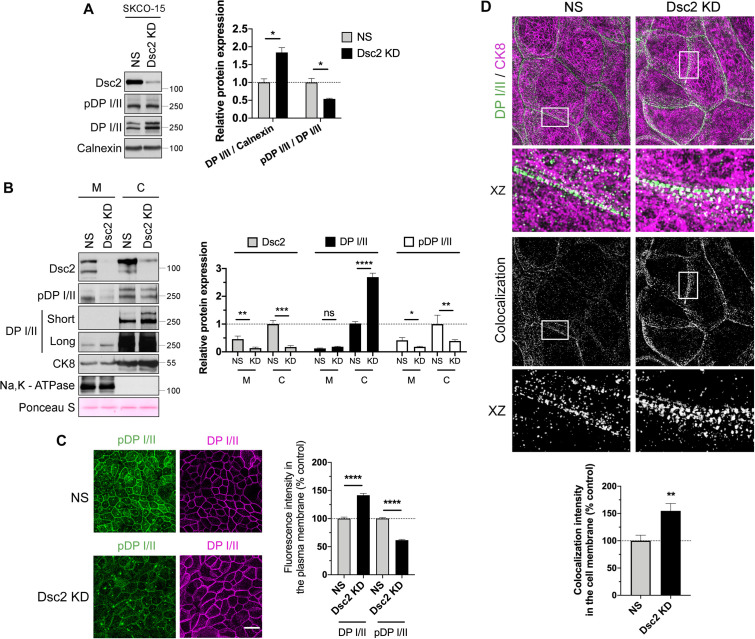
FIGURE 7:
Dsc2 KD resulted in reduced DP I/II phosphorylation at Ser2849 and enhanced interaction of DP I/II to IF-cytoskeleton. (A) Left panel shows representative WB images of the expression of Dsc2, pDP, DP I/II, and calnexin (loading control) in whole cell lysates derived from SKCO-15 Dsc2 KD vs. NS cells. Bar graphs in the right panel show densitometric analysis of DP I/II expression normalized to calnexin and ratio pDP/ DP I/II. Data represent mean ± SEM of three independent experiments. Statistical analysis was done with two-tailed Student’s t test. *p < 0.05. (B) Membrane and cytoskeletal fractions were isolated from Dsc2 KD and control SKCO-15 cells. The left panel shows representative WB images of the expression of Dsc2, pDP I/II, DP I/II, Na,K - ATPase (membrane marker), and CK8-IF marker in Dsc2 KD vs. NS cells. Ponceau S staining serves as a loading control for total protein normalization. The right panel shows the densitometry analysis. Data represent mean ± SEM of five independent experiments. Statistical analysis was done with wo-tailed Student’s t test. ns, not significant; *p < 0.05.**p < 0.01; ***p < 0.001; ****p < 0.0001. (C) The left panel shows confocal microscopy images of pDP S2849 and DP I/II in SKCO-15 control (NS) vs. Dsc2 KD confluent monolayers. Scale bars are 40 μm. The right panel shows histograms depicting fluorescence intensity of DP I/II and pDP S2849 in the plasma membrane of KD confluent monolayers compared with NS control. Results show the mean ± SEM of three independent experiments, each one assayed in two technical replicates with a total of 24 images per condition. A total of 160 and 170 cell–cell contacts were analyzed for NS and Dsc2 KD cells, respectively. Statistical analysis was done with two-tailed Student’s t test. ****p < 0.0001. (D) Top panel, structured illumination microscopy images showing DP I/II (green) and CK8 (magenta) in SKCO-15 control (NS) and Dsc2 KD cells. Rectangles mark zoomed in areas. Scale bar is 5 μm. Bar graphs in the bottom panel show the fluorescence colocalization analysis, generated by Pearson´s correlation coefficients, between DP I/II and CK8 signals in the cell membrane in Dsc2 KD cells compared with NS cells. Results show the mean ± SEM of three individual experiments with a total of 12 images per condition, each one assayed in two technical replicates. For DP-CK8 interaction, a total of 70 and 75 cell–cell contacts were analyzed for NS and Dsc2 KD cells, respectively. Statistical analysis was done with two-tailed Student’s t test. **p < 0.01.

