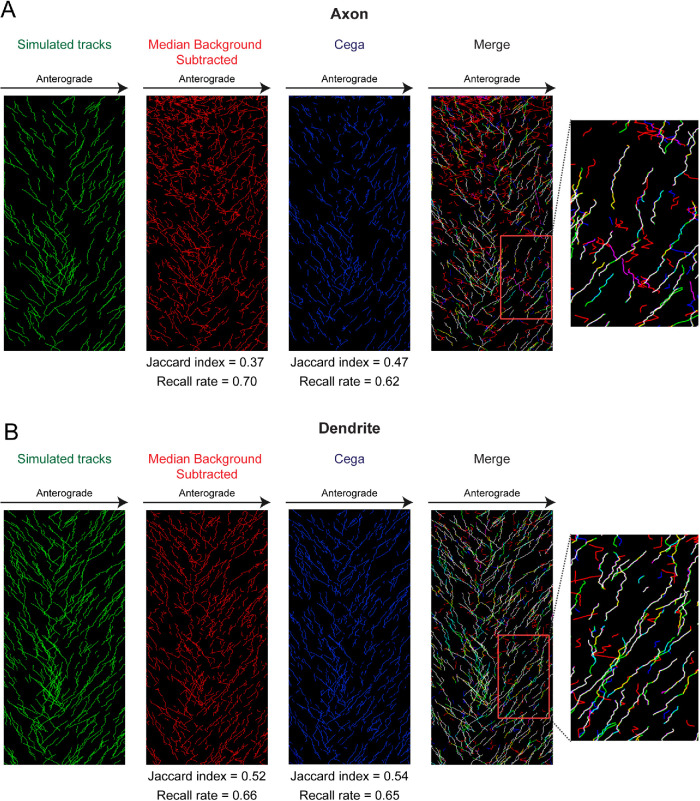
FIGURE 3:
Analysis of tracking after Cega or median background subtraction methods. Simulated data using axonal background signal was used where mean photon emissions were set to 200 photons, which corresponds to a SNR of 2.8. (A, B) Kymographs of tracks determined from simulated particles within axonal and dendritic compartments. Although the same number of particles were simulated in the axonal and dendritic movies, the dendritic movie was smaller in size, resulting in a higher density of particles. In the merge kymograph and zoom-in area, cyan indicates locations where only simulated tracks and Cega detected tracks overlap, whereas yellow indicates where only simulated tracks and median background-subtracted detected tracks overlap. Magenta tracks are where only Cega and median background-subtracted tracks overlap. Jaccard indices and recall rates for tracks determined after Cega filtering and median background subtraction are listed below each corresponding kymograph.

