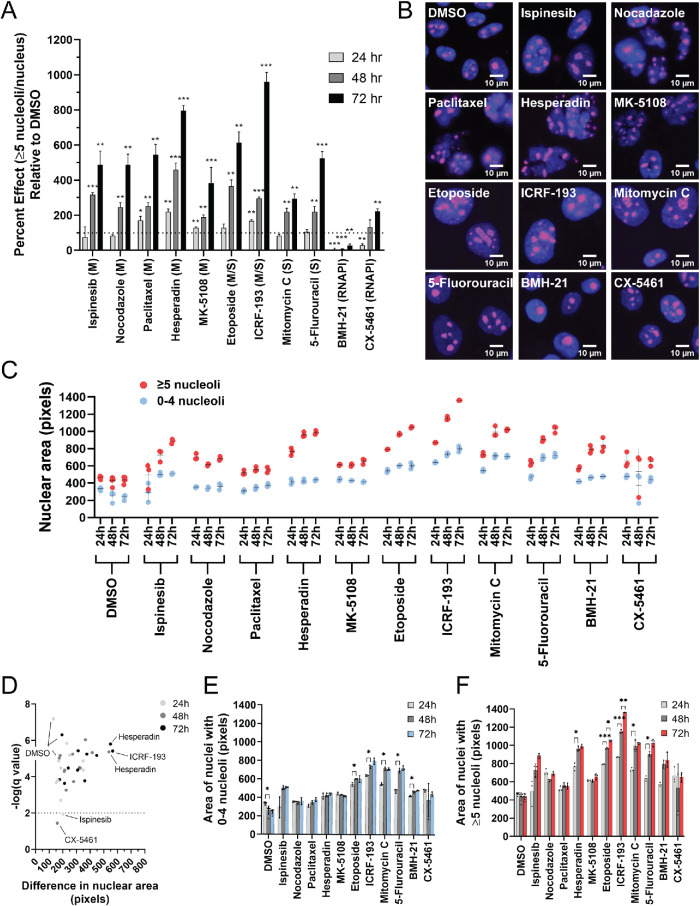
FIGURE 6:
Inhibition of mitosis and DNA replication, but not RNAPI, increases the percentage of nuclei with ≥5 nucleoli. (A) Inhibition of mitosis and DNA replication, but not RNAPI, increases the percentage of nuclei with ≥5 nucleoli. The ≥5 nucleoli per nucleus PE was quantified relative to the negative control, DMSO (set to 100 PE), in MCF10A cells treated with a panel of small molecule inhibitors of the cell cycle for 24 h (light gray), 48 h (medium gray), and 72 h (dark gray) in triplicate (72–96 replicates of DMSO were performed). A dotted line is drawn at 100 PE. M = inhibitors of mitosis (ispinesib, nocodazole, paclitaxel, hesperadin, and MK-5108). S = inhibitors of DNA replication (mitomycin C and 5-fluorouracil). M/S = inhibitors of both mitosis and DNA replication (topoisomerase II inhibitors: etoposide and ICRF-193). RNAPI = inhibitors of RNAPI transcription (BMH-21 and CX-5461). Statistical significance was calculated by unpaired t tests with the Holm–Sidak method of correction for multiple comparisons (* = p < 0.05, ** = p < 0.01, *** = p < 0.001; n = 3). (B) Representative merged immunofluorescent images of the data collected for the analysis of nucleolar number at the 72 h time point in A. Shown are a selection of nuclei (100 × 100 μM) enlarged threefold using bicubic interpolation from a single field of view. Hoechst 33342 = nuclei (blue) and an antibody to the nucleolar protein fibrillarin (72B9; Reimer et al., 1987) = nucleoli (pink). (C) Nuclear area is greater in nuclei with ≥5 nucleoli. Nuclear area was quantified in pixels using CellProfiler analysis of the images collected for the nucleolar number analysis in A. Three replicates were analyzed for each drug treatment and time point, and six replicates were analyzed for the control, DMSO, treatment at each time point. Each dot represents a single replicate, and the mean ± SD is shown as a black line. Red dots = nuclei with ≥5 nucleoli. Blue dots = nuclei with 0–4 nucleoli. (D) Volcano plot of the statistical analysis of the data in C reveals that with all but two treatments (ispinesib [24 h] and CX-5461 [48 h]), including DMSO treatment, nuclei with ≥5 nucleoli are significantly larger than nuclei with 0–4 nucleoli. Unpaired t tests were performed, and significance was determined based on a false discovery rate approach using the two-stage step-up method of Benjamini et al. (2006) (n = 3 or 6; q < 0.01/-log q-value > 2). Light gray dots = 24 h treatments. Medium gray dots = 48 h treatments. Dark gray dots = 72 h treatments. The x-axis represents the difference in nuclear area between nuclei with 0–4 nucleoli and ≥5 nucleoli. The greatest difference in nuclear area between the nuclei with 0–4 nucleoli and ≥5 nucleoli are observed with hesperadin treatment (48 and 72 h) and ICRF-193 treatment (72 h). (E) Treatment with a subset of drugs, but not all, led to a significant increase in nuclear area from 24 to 48 h in nuclei with 0–4 nucleoli. Significance was determined by unpaired t tests and a false discovery rate approach using the two-stage step-up method of Benjamini et al. (2006) (n = 3 or 6; q < 0.01 = *). (F) Treatment with a subset of drugs, but not all, led to a significant increase in the nuclear area at subsequent time points of nuclei with ≥5 nucleoli. Significance was determined by unpaired t tests and a false discovery rate approach using the two-stage step-up method of Benjamini et al. (2006) (n = 3 or 6; q < 0.01 = *; q < 0.001 = **; q < 0.0001 = ***).

