FIGURE 7:
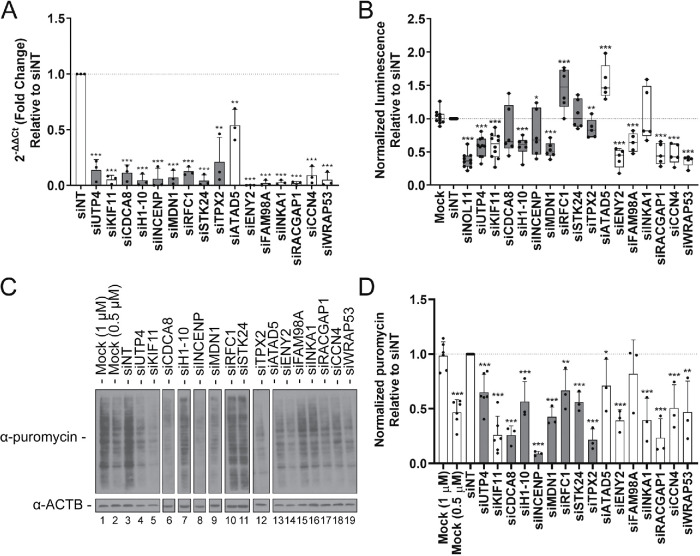
Functional assessment of hits reveals proteins required for RNA polymerase I transcription and global protein synthesis. (A) qPCR analysis confirms depletion of a subset of validated nucleolar (n = 7; gray) and nonnucleolar (n = 7; white) screen hits in MCF10A cells. After depletion using pools of siRNAs targeting the indicated genes, respectively, or nontargeting siRNA control (siNT), the mRNA levels were quantified relative to β-actin mRNA expression. Relative expression values were calculated using the comparative CT method. Statistical significance for three biological replicates, each with three technical replicates, was performed using a two-tailed, unpaired t test. All comparisons are relative to siNT (p < 0.05 = *, p < 0.01 = **, p < 0.001 = ***; n = 3). Data are shown as a bar graph (mean ± SD) and with each replicate shown as a dot. (B) Depletion of the selected hits reveals 11/14 significantly decrease or increase RNAPI transcription. RNAPI transcription was assayed using a dual-luciferase reporter system, with firefly luciferase gene expression controlled by the human rDNA promoter (–410 to +314; Ghoshal et al., 2004). Data were normalized to Renilla luciferase expression controlled by the constitutive CMV promoter. Statistical significance for fivr or six replicates relative to siNT was calculated by two-tailed, unpaired t tests (* = p < 0.05, ** = p < 0.01, *** = p < 0.001; n = 5 or 6). Data are shown as minimum to maximum box-and-whiskers plots, and with each replicate represented as a dot. Gray = nucleolar proteins; white = nonnucleolar proteins. (C) Protein synthesis was significantly decreased in 13/14 of the hit depletion conditions. Shown are representative Western blots from the total protein harvested from hit-depleted MCF10A cells treated with 1 μM puromycin for 1 h. Protein was quantified by Bradford assay and run on a 10% SDS–PAGE gel followed by Western blots using an antibody to puromycin to test for puromycin incorporation into the nascent peptides. β-Actin (ACTB) was used as a loading control. Mock (0.5 μM) cells were treated with half the concentration of puromycin. (D) Quantification of results in C from three replicates. ImageJ was used to quantify the differences in puromycin signal intensity, normalized to the β-actin signal intensity. Statistical significance for the three replicates relative to siNT was calculated by two-tailed, unpaired t tests (* = p < 0.05, ** = p < 0.01, *** = p < 0.001; n = 3). Data are shown as a bar graph (mean ± SD), and with each replicate represented as a dot. Gray = nucleolar proteins; white = nonnucleolar proteins.

