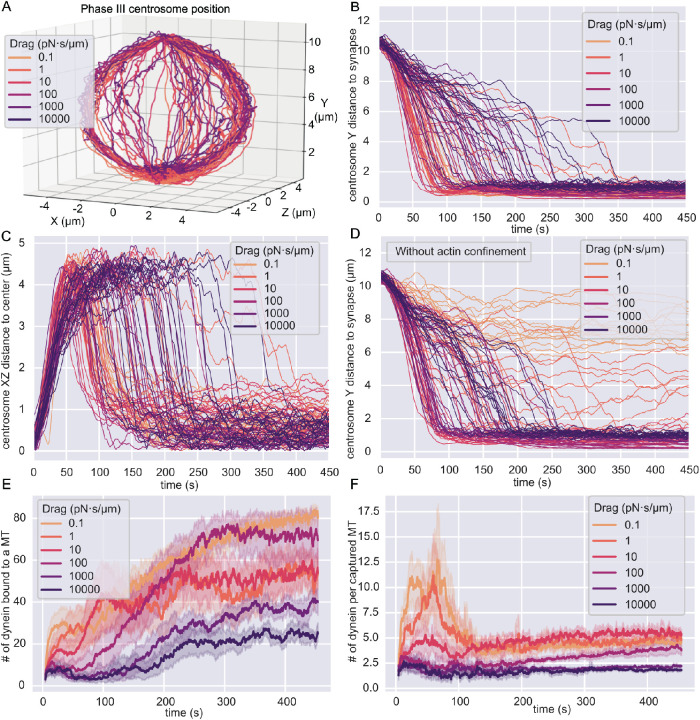
FIGURE 2:
Centrosome translocation in different models. In all figures, the colors indicate different numerical values for the drag coefficient of dynein molecules in the membrane. The time given in B–F represents the time in phase III. (A) Three-dimensional trajectories of the center of the centrosome. Each line represents one simulation. (B) The height above the synapse as the Y-component of the position of the centrosome’s center as a function of time. Each line is the result from one simulation. Increasing dynein’s drag coefficient, as indicated by the different colors, prolongs the time for the centrosome to translocate to the IS. (C) The radial distance from the centrosome’s center to the central axis of the cell as a function of time. Each line represents one simulation. (D) The Y-component of the position of the centrosome above the IS as a function of time in simulations without the actin ring. In this model, dynein molecules can move on the surface of the MT-bounding volume. (E) The total number of dynein molecules bound to MTs as a function of time averaged over all simulations for a specific drag coefficient. The 95% confidence interval is the shaded area. (F) The number of dynein molecules bound to MTs normalized by the number of MTs that are anchored by at least one dynein. This quantity is averaged over all simulations for a specific drag coefficient and gives a relative measure of MT decoration by dynein. The 95% confidence interval of the average is the shaded area.

