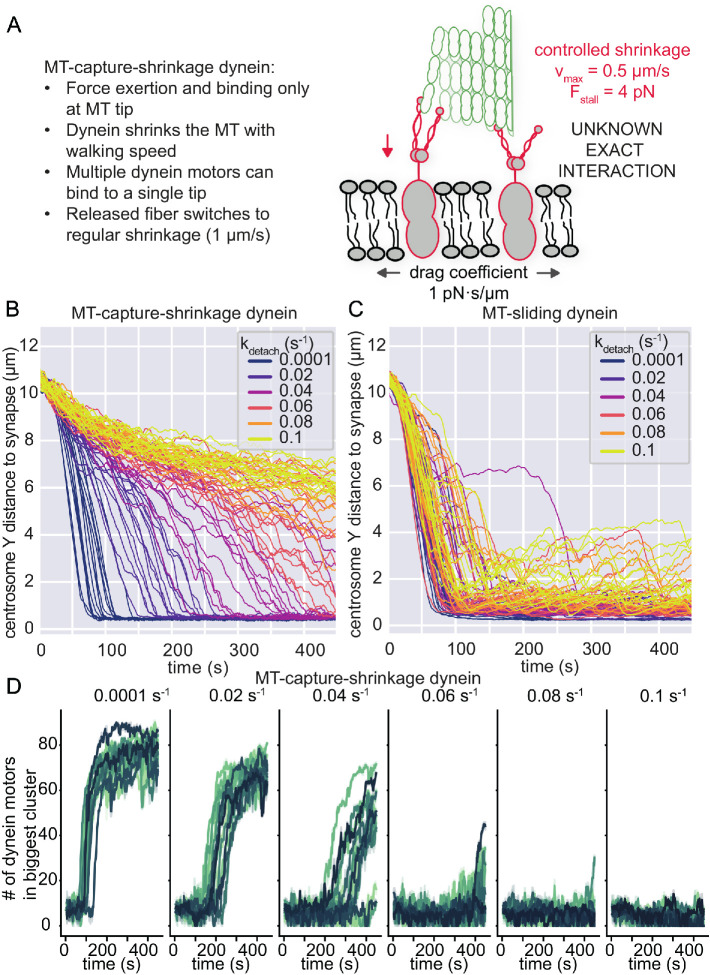
FIGURE 4:
MT-capture-shrinkage also shows dynein clusters in the IS, but is unable to reliably translocate the centrosome. (A) A minimal model of MT-capture-shrinkage dynein for centrosome translocation in T-cells. Dynein molecules induce a form of controlled shrinkage of the MT and pull on it by holding onto the shrinking MT tip. These dynein molecules are attached to mobile anchors in the membrane, with a lateral mobility that is parameterized by a drag coefficient, fixed to 1 pN·s/µm. (B) Traces of the position of the centrosome as a function of time in the Y direction for MT-capture-shrinkage dynein. Different colors indicate different values of the unbinding rate kdetach. (C) Traces of the position of the centrosome as a function of time in the Y direction for MT-sliding dynein. Different values of the unbinding rate are indicated by the different colors. (D) The number of dynein molecules in the biggest cluster of dyneins as a function of time from simulations with MT-capture-shrinkage dynein. The colors encode different runs of our simulations. To reduce the noise, we average the trajectories over a window of 1.6 s and show the 95% confidence interval as the shaded area. For each panel, the unbinding rate is given on the top.

