Fig. 1.

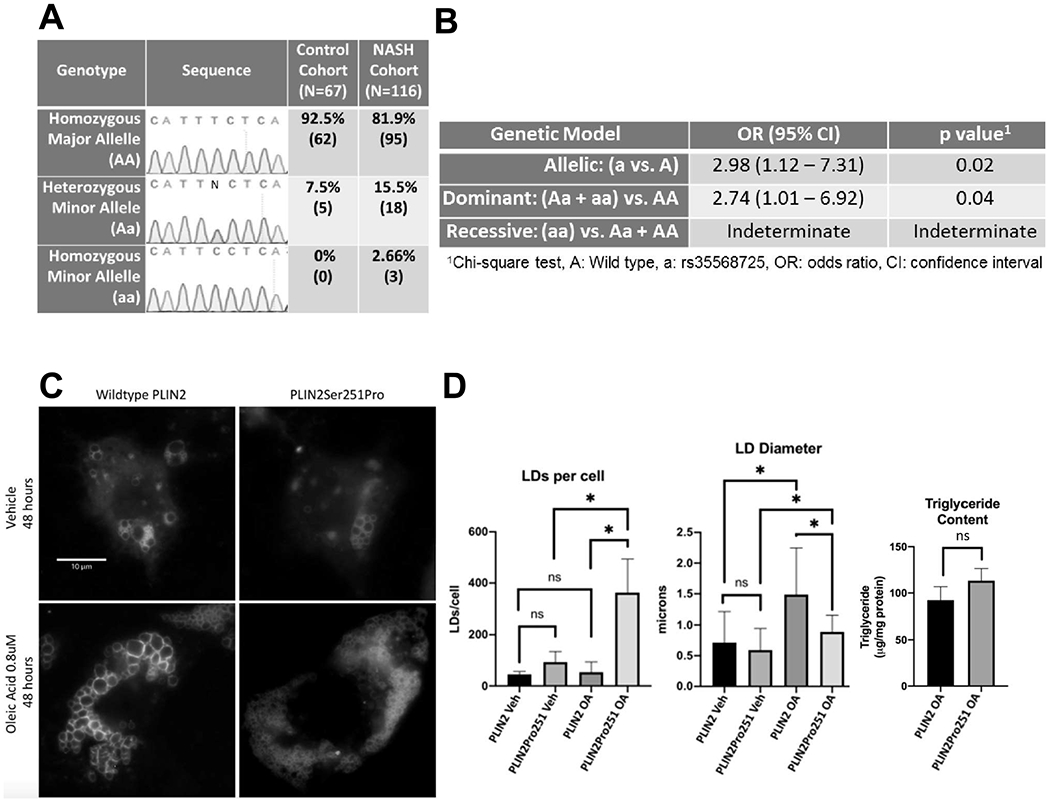
A) Representative electropherograms and distribution of PLIN2 genotypes in study subjects, stratified by control and NASH cohorts. B) Allelic, dominant and recessive inheritance models and odds ratios (OR) for NASH conveyed by the rs35568725, aka the minor allele (a). C) Fluorescence microscopy of representative single Huh7 hepatocytes expressing green fluorescent protein (GFP) tagged-PLIN2 (left) and GFP-PLIN2Pro251 (right) localized to LDs treated with vehicle (top) and 0.8 μm oleic acid for 48 h (bottom), scale bar = 10 μm. D) LDs per cell (left) and LD diameter (middle) quantified from ≥10 cells with similar GFP-PLIN2 and GFP-PLIN2Pro251 expression levels under all experimental conditions from 3 independent experiments (N = 3) and triglyceride levels (right) of steatotic flow cytometry-sorted GFP-positive Huh7 hepatocytes expressing GFP-PLIN2 versus GFP-PLIN2Pro251 normalized to total cellular protein (N = 4). Veh, vehicle treatment; OA, oleic acid 0.8 mM 48 h; ns, not significant; error bar = 1 standard deviation. *p < 0.05.
