
Fig. 3. Age is negatively correlated with TL in most tissues, and correlation is strongest in tissues with shorter telomeres.
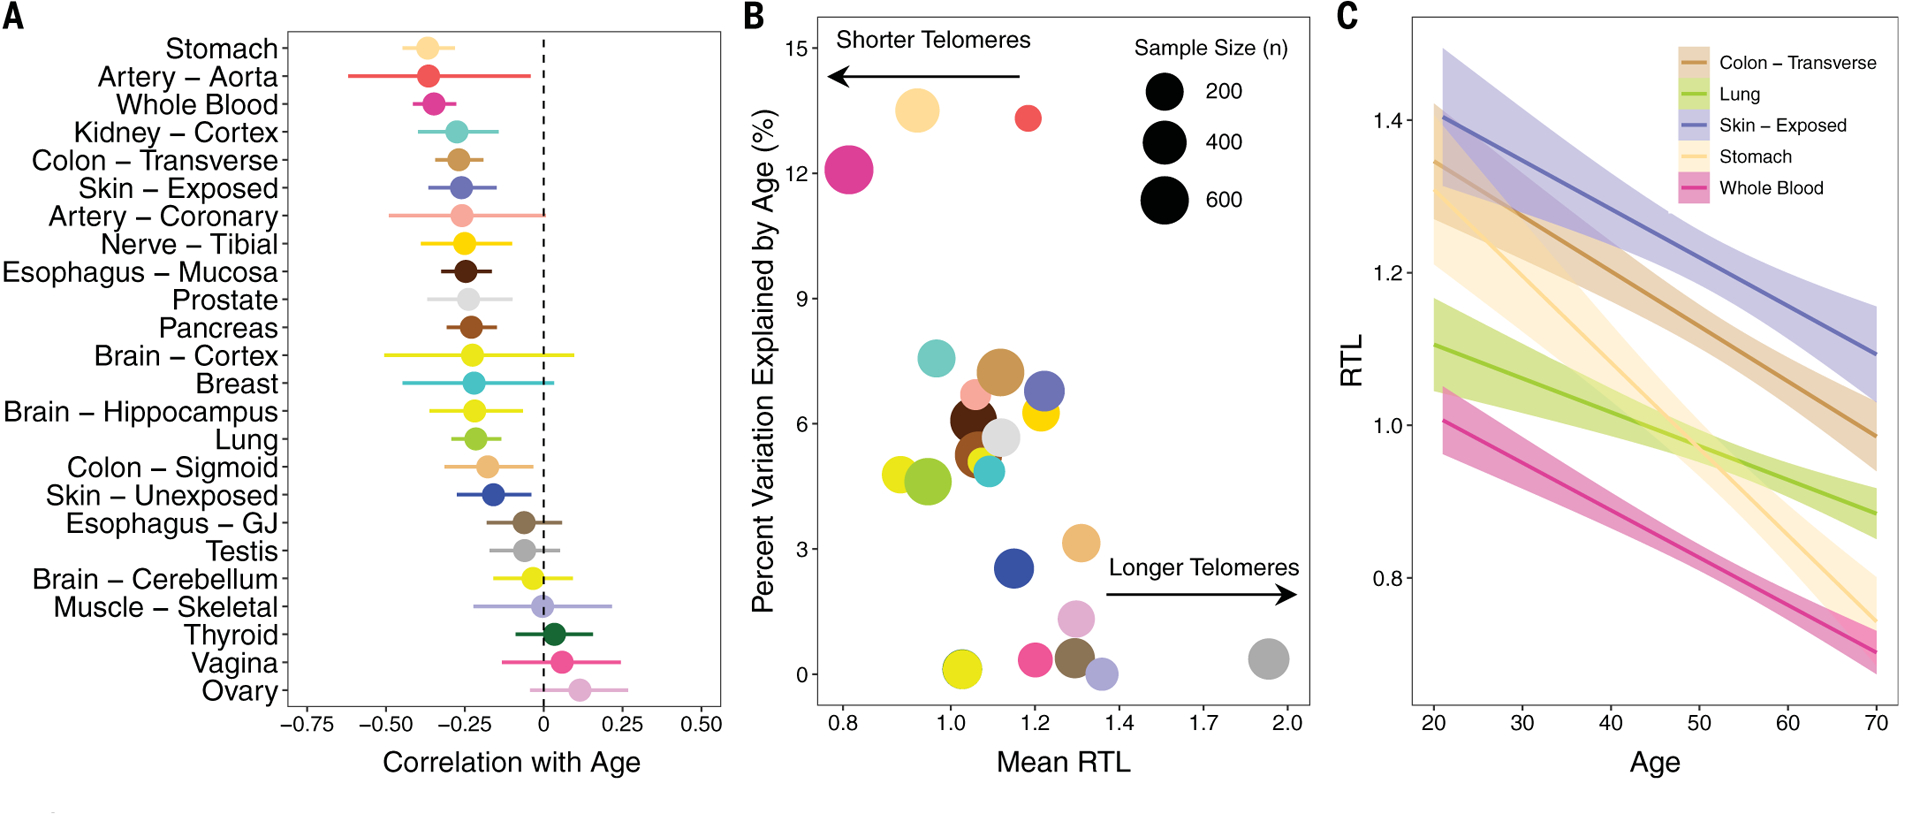
(A) Pearson correlations between age and tissue-specific RTL measures. (B) Scatterplot of mean RTL for each tissue versus the percent variation explained by age (r2) for each tissue. The size of each point is proportional to sample size for that tissue type. (C) Relationship between RTL and age for five selected tissue types [WB, lung, stomach, transverse colon, and skin (exposed)]. For all plots, colors correspond to tissue type.