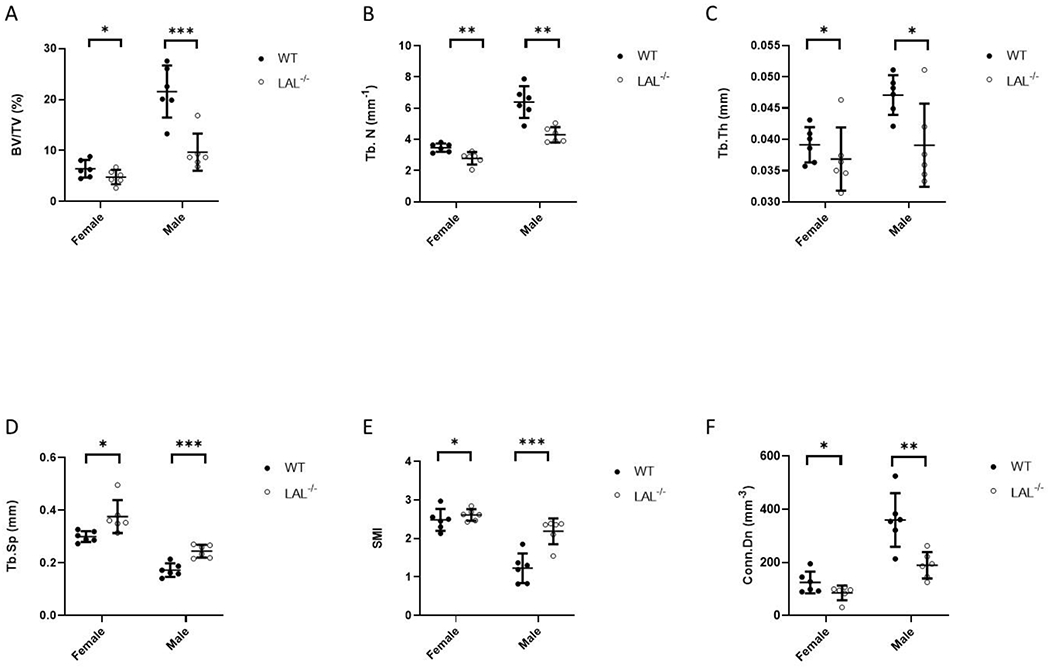
Figure 1. Male and female LAL−/− mice have low trabecular bone mass.

F1 Legend: Results from micro-computed tomography (μCT) analysis (A-F) of the trabecular bone in the distal femur metaphysis from 16-week-old WT and LAL−/− mice. A) Bone volume per total volume (BV/TV, %); B) Trabecular number (Tb.N); C) Trabecular thickness (Tb.Th.); D) Trabecular separation (Tb.Sp.); E) Structure model index (SMI); and F) Connectivity density (Conn. Dens., 1/mm3). Plots represent individual data points, mean, and standard deviation. Student’s T-Test was used to calculate significance (*; p < .05, **; p < .01, ***; p < .001).
