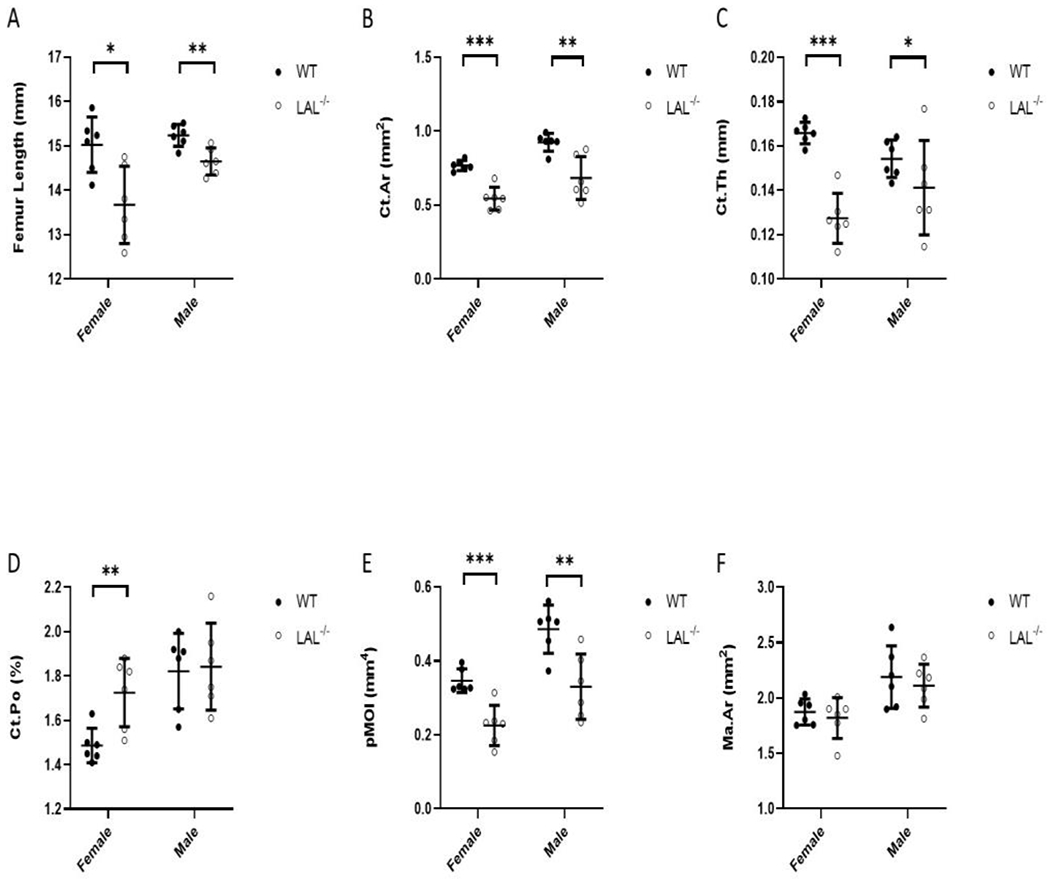
Figure 2: LAL Deficiency reduced cortical bone parameters.

F2 Legend: Micro-computed tomography (μCT) analysis (A-F) of the cortical bone assessed at the femur diaphysis from 16-week-old WT and LA−/− mice. A) Femur length; B) Cortical bone area (Ct.A); C) Cortical thickness (Ct.Th.); D) Cortical Porosity (Ct.Po.); E) Polar moment of inertia (pMOI); and F) Bone marrow area (Ma.Ar). Plots represent individual data points, mean, and standard deviation. Student’s T-Test was used to calculate significance (*; p < .05, **; p < .01, ***; p < .001).
