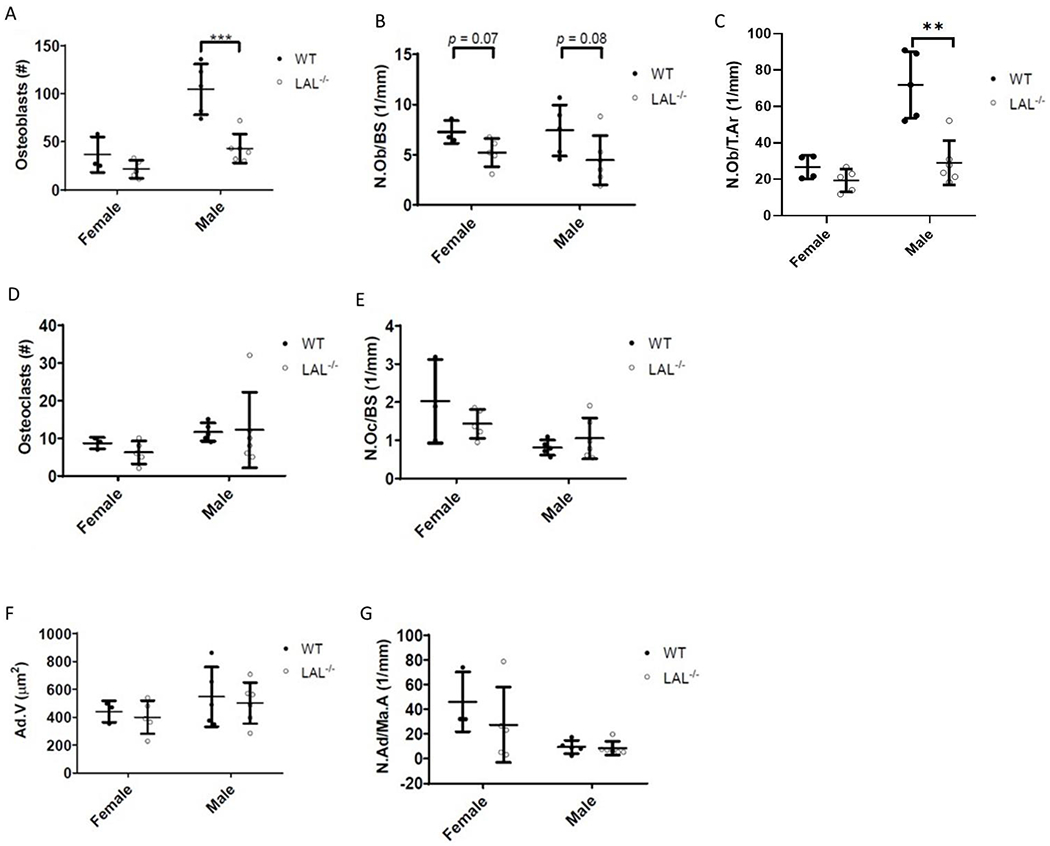
Figure 3: Male LAL−/− mice have fewer osteoblasts.

F3 Legend: Histological analysis of the trabecular bone of the proximal tibia of 16-week-old WT and LAL−/− mice. Number of A) osteoblasts (N.Ob.), B) osteoblasts per millimeter bone surface (N.Ob/BS, 1/mm), C) number of osteoblasts per total area (N.Ob./T.Ar); D) osteoclasts (N.Oc), and E) osteoclasts per millimeter of bone surface (N.Oc/BS, 1/mm). F) Average adipocyte volume (Ad.Vol, μm2). G) Adipocytes per bone marrow area (N.Ad/Ma.Ar, 1/mm). Plots represent individual data points, mean, and standard deviation. Student’s T Test was used to calculate significance (*; p < .05, **; p < .01, ***; p < .001).
