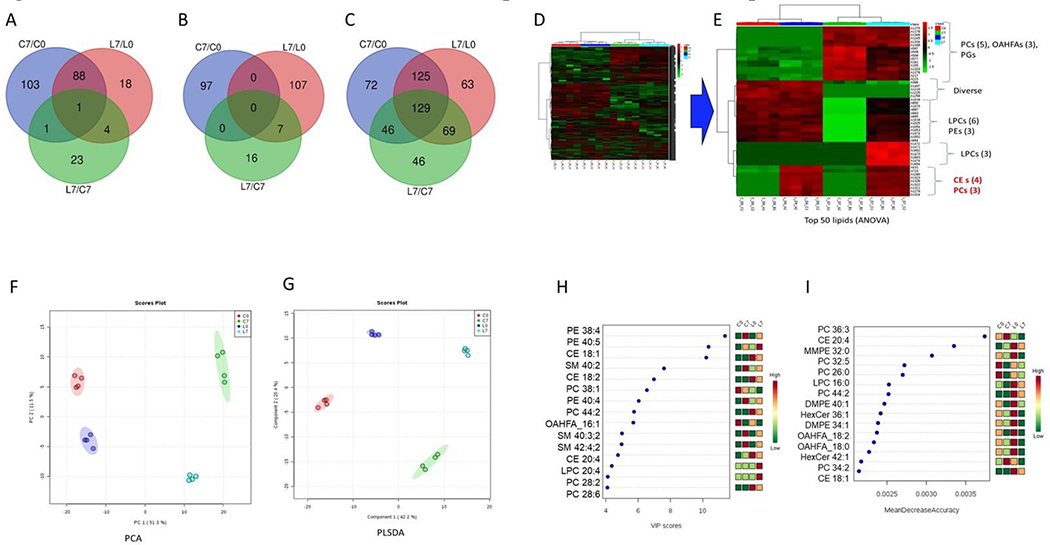
Figure 5: Inhibition of LAL in osteoblasts results in profound alterations in lipid metabolism.

F5 Legend: A) Upregulated lipids (FC cut off >1.2) B) Downregulated lipids (FC cut off< 0.8) and C) Significantly dysregulated (both up and down) lipids (p-value < 0.05). Hierarchical clustering for D) all 823 lipids and E) top 50 statistically significant ANOVA resulted lipids. F) Principle component analysis (PCA) and G) partial least squared discriminant analyses (PLSDA) score plots. H) Variable importance in projection (VIP) scores from PLSDA models. I) Mean decrease accuracy from random forest (RF) analysis.
