
Figure 2. IFN-γ released from liver ILC1 has a protective role in CCl4-induced acute liver injury.
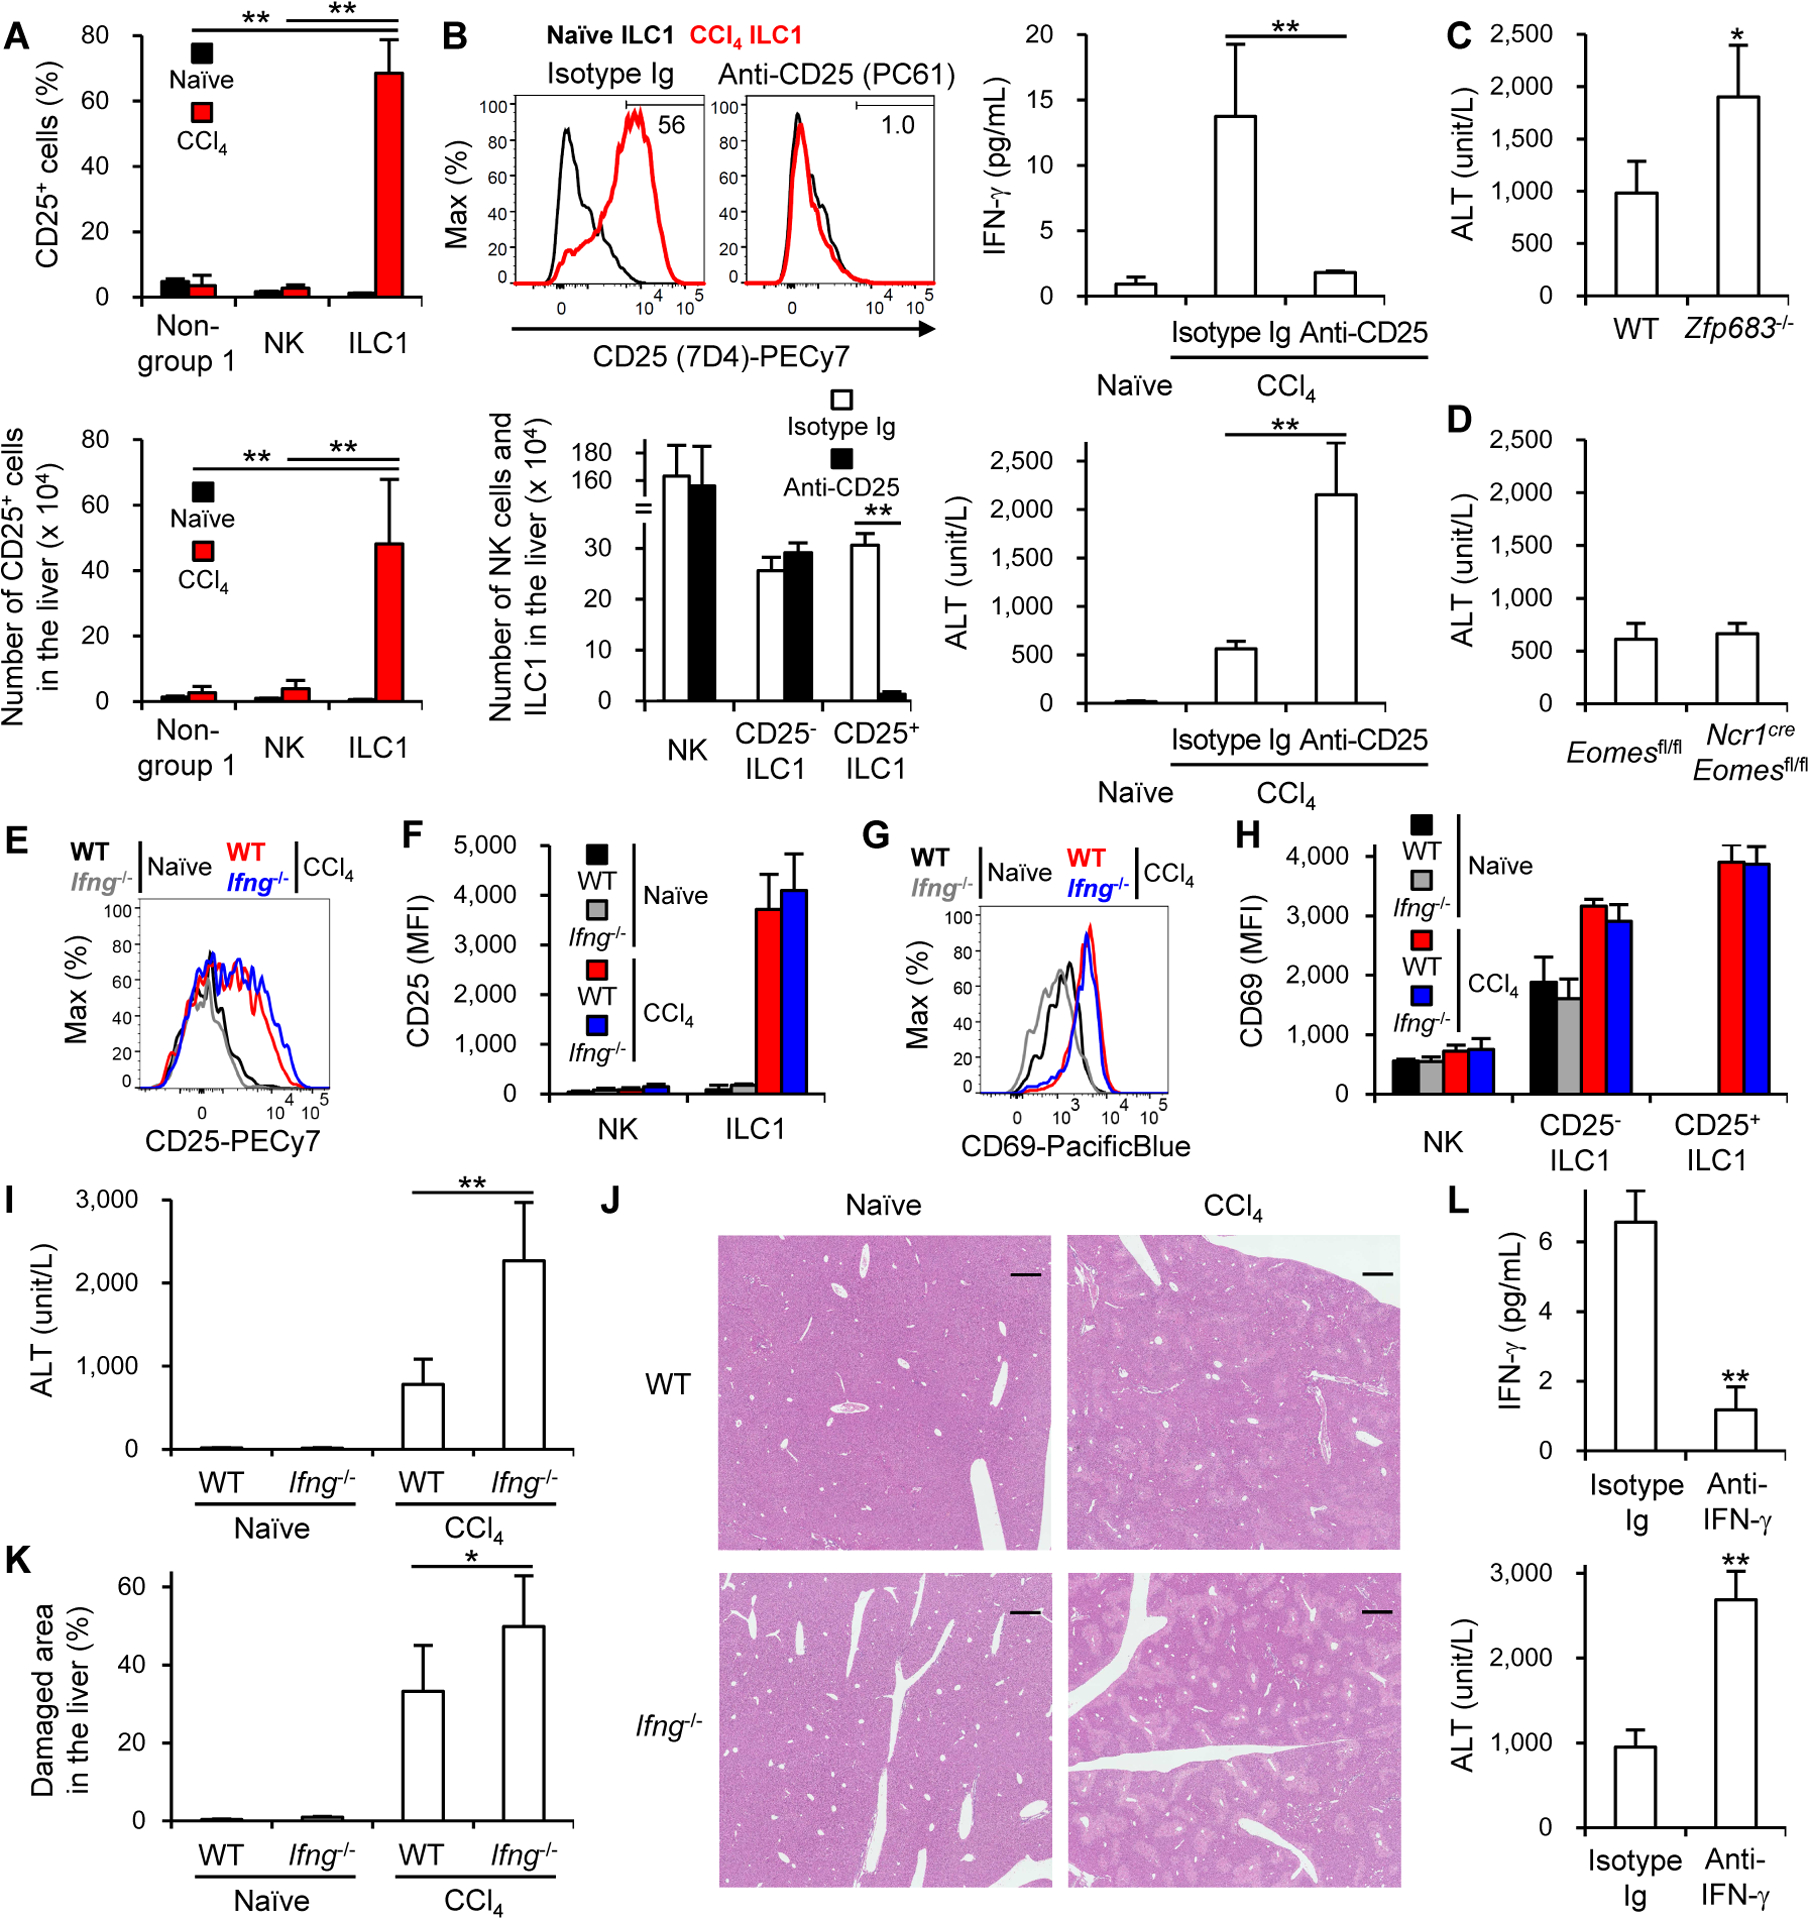
(A) The percentages and number of CD25+ cells in the liver of Rag1−/− mice before (naïve) and 18 h after CCl4 injection. Data were pooled from 2 experiments (n = 4–6). (B) The percentages of CD25+ (7D4+) ILC1 (upper left) (n = 3) and number of each lymphocyte subset in the liver (lower left) and plasma concentrations of IFN-γ (upper right) and ALT (lower right) of Rag1−/− mice that had been injected with a depletion anti-CD25 mAb (PC61) or isotype-matched Ig (Isotype Ig) 18 h after CCl4 injection. Data were pooled from 2 (lower panels) (n = 6) and 3 (upper right) (n = 6–10) experiments. (C) Plasma concentrations of ALT of WT and Zfp683−/− mice 18 h after CCl4 injection. Data were pooled from 2 experiments (n = 4–8). (D) Plasma concentrations of ALT of Eomesfl/fl and Ncr1creEomesfl/fl mice 18 h after CCl4 injection. Data were pooled from 2 experiments (n = 7). (E) Expression of CD25 on ILC1 in the liver of WT and Ifng−/− mice before (naïve) and 18 h after CCl4 injection (n = 2–4). (F) MFI of CD25 on NK cells and ILC1 in the liver of WT and Ifng−/− mice before and 18 h after CCl4 injection. Data were pooled from 2 experiments (n = 3–7). (G) Expression of CD69 on ILC1 in the liver of WT and Ifng−/− mice before and 18 h after CCl4 injection (n = 2–4). (H) MFI of CD69 on NK cells, CD25− ILC1, and CD25+ ILC1 in the liver of WT and Ifng−/− mice before and 18 h after CCl4 injection. Data were pooled from 2 experiments (n = 3–7). (I) Plasma concentrations of ALT before and 18 h after CCl4 injection. Data were pooled from 3 experiments (n = 4–10). (J) Histology of the liver (hematoxylin and eosin staining) before and 18 h after CCl4 injection (n = 2–4). Scale bars represent 500 μm. (K) Quantified damaged areas around the central veins and the portal veins of mice before and 18 h after CCl4 injection. Data were pooled from 2 experiments (n = 3–7). (L) Plasma concentrations of IFN-γ (upper) and ALT (lower) of mice (that had been injected with a neutralizing anti-IFN-γ mAb or isotype Ig 6 h before and 6 h after CCl4 injection) 18 h after CCl4 injection. Data were pooled from 2 experiments (n = 8). Data are representative of 2 independent experiments (B (upper left), E, G, and J). *p<0.05, **p<0.005. Error bars show s.d. See also Figure S3.