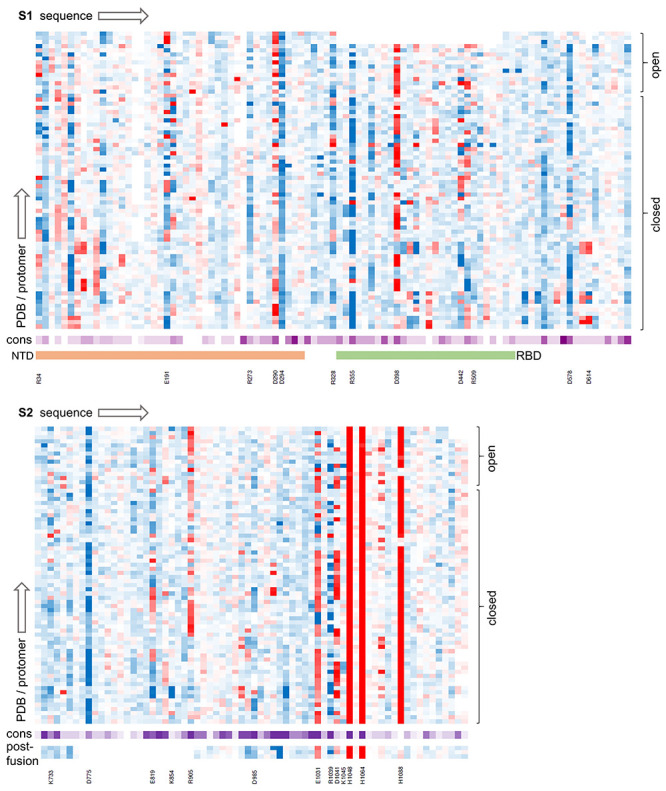
Figure 1.

Ionizable group properties in the trimer dataset. Predicted changes in ionizable group pKas in a heat map, from brighter red (destabilizing) to darker blue (stabilizing), with separate panels for S1 (upper) and S2 (lower) proteins. Calculations are grouped according to open and closed monomers (RBD), as indicated. Sequence conservation across coronaviruses is shown with a deeper purple for greater conservation. Residues discussed in the text are listed, and the extent of NTD and RBD domains is displayed for S1.
