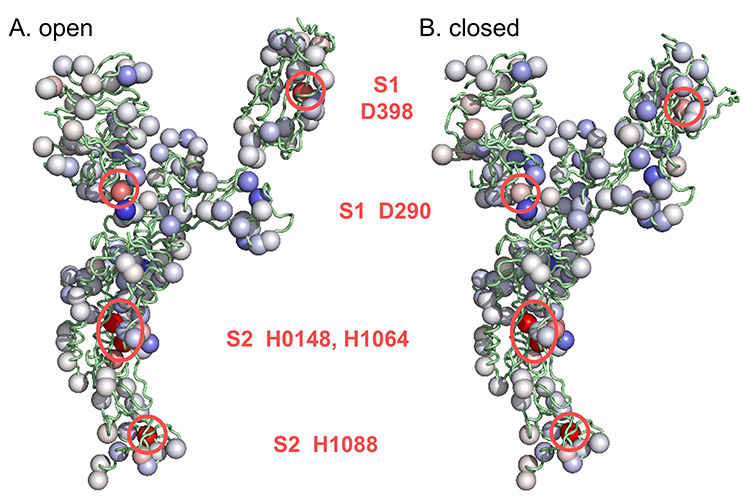
Figure 2.

Averaged predicted ΔpKas in molecular display. Ionizable groups are coloured using the same scale as Figure 1 (red is destabilizing, blue is stabilizing), here with averages over the open (A) and closed (B) form monomers. Sites of greater destabilization are highlighted and their identity noted.
