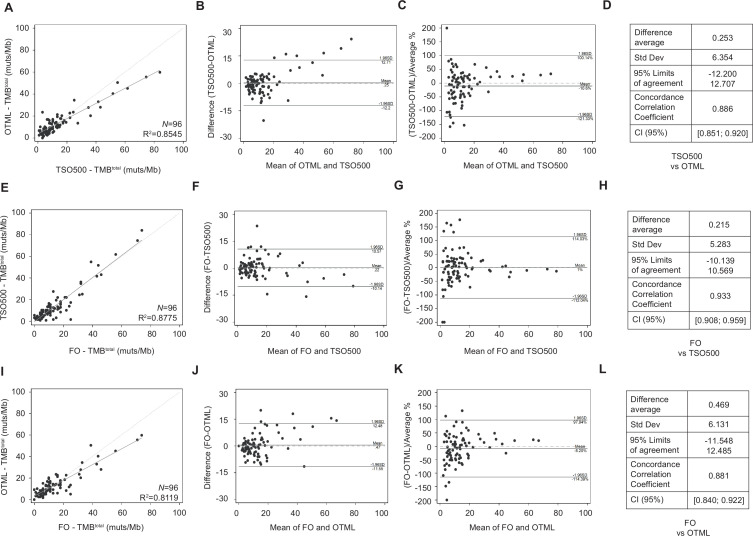
Figure 1.
Quantification of the degree of agreement between tumor mutational burden (TMB) determination methods. (A–D) Comparison between TruSight Oncology 500 (TSO500) and Oncomine Tumor Mutation Load (OTML). (E–H) Comparison between Foundation One (FO) and TSO500. (I–L) Comparison between FO and OTML. (A, E, I) Linear regression analyses between methods. (B, F, J) Agreement measurement represented by the difference between the methods against the average of both methods (Bland-Altman plots). (C, G, K) Agreement measurement represented by the difference between the methods divided by the average %, versus the mean of both methods. Transformation of Bland-Altman plots with a correction that allows for easier visualization. (D, H, L) Degree of agreement shown by the average difference, SD, 95% limits of agreement, concordance correlation coefficient and 95% CI. TMB was calculated as total (synonymous and non-synonymous mutations per megabase of DNA) in a cohort of N=96 early-stage non-small cell lung cancer tumors.

