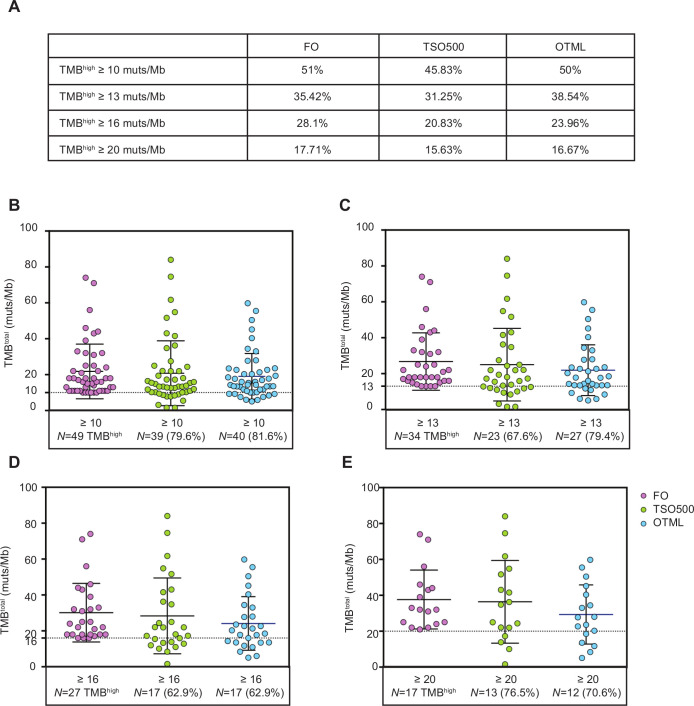
Figure 4.
Visual distribution of tumor mutational burden (TMB) values obtained with TruSight Oncology 500 (TSO500) or Oncomine Tumor Mutation Load (OTML) for samples categorized as TMBhigh with Foundation One (FO), using different cut-off values. (A) Summary of the percentage of patients from the study cohort (N=96) that would be categorized as TMBhigh using four different cut-off values for the two panels versus FO. Care should be exercised interpreting the data, as the percentages are similar; patients included in the high or med/low categories are interchangeable between the tests if the same cut-offs are used. (B–E) Samples were selected in the TMBhigh category based on their total TMB value obtained with FO test and selected according to the four different cut-offs: TMBtotal ≥10 (B, N=49), ≥13 (C, N=34), ≥16 (D, N=27) or ≥20 (E, N=17) muts/Mb, respectively. Only samples above the selected threshold by FO (samples in pink) are likewise plotted in the same graph for TSO500 and OTML. TMB values obtained with TSO500 (green) and OTML (blue) are shown. Several patients that are categorized as TMBhigh according to the standard method would have been missed with TSO500 and/or OTML if the same cut-off value was maintained. Some adjustments were necessary to increase the sensitivity of the tests.

