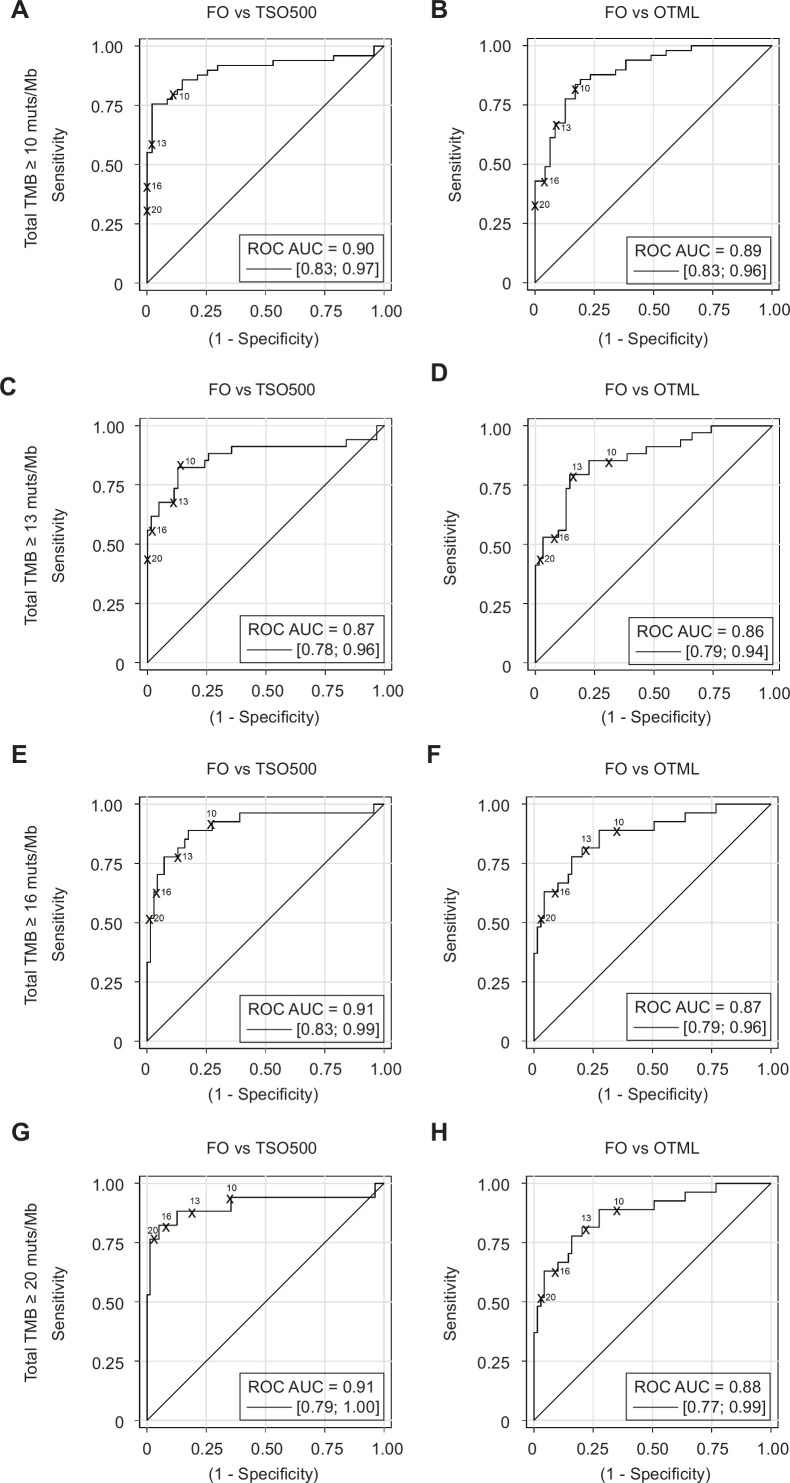
Figure 5.
Evaluation of the sensitivity, specificity, positive predictive value and negative predictive value of the tests. Receiver operating characteristic (ROC) curves for the TruSight Oncology 500 (TSO500) versus Foundation One (FO) (A, C, E, G) and Oncomine Tumor Mutation Load (OTML) versus FO (B, D, F, H) comparisons are shown. Graphs were plotted by selecting four different high tumor mutational burden (TMBhigh) cut-off values for the FO test: TMBtotal ≥10 muts/Mb (A, B, N=49), ≥13 muts/Mb (C, D, N=34), ≥16 muts/Mb (E, F, N=27) or ≥20 muts/Mb (G, H, n=17). Assuming that FO is the reference test, values above the selected cut-off in each case are positives and values under the selected cut-off are negatives. The behavior of the panel under evaluation is then observed in a continuous model. Areas under the curve (AUC) are shown for each graph. The four theoretical cut-off values are indicated in the eight different graphs. Empirical cut-off values have been statistically obtained, as well as the adjusted cut-off values for each panel that are proposed to be equivalent to the four different cut-off values for FO. Complete datasets are available in online supplemental table S4.

