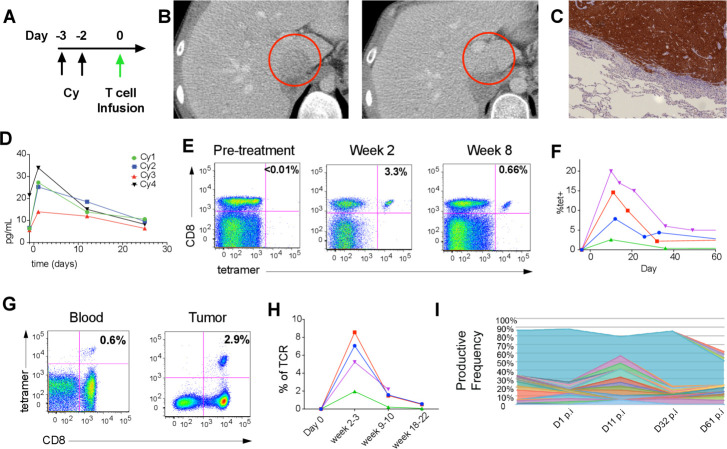
Figure 1.
Clinical response and T-cell persistence. (A) Trial schema. (B) Response in liver lesion in patient Cy2. (C) NY-ESO-1 staining in a lung metastasis from patient Cy 4. (D) Serum IL-15 concentration. (E) Representative flow cytometry plots depicting gating of tet+ cells in peripheral blood of Cy1. (F) Percentage of tet+ cells of CD8 T cells before infusion and at various times post-infusion for 4 patients Cy1 (blue), Cy2 (red), Cy3 (green) and Cy4 (magenta). (G) Flow cytometry plots depicting tet+ cells in single cells isolated from blood and tumor digest from approximately 3 months after cell transfer from Cy1. (H) Persistence of dominant clone by T-cell receptor (TCR) sequencing (colors included are as in D). (I) Sequencing of TCRβ chain depicting different T-cell clones in different colors before infusion and at various times post-infusion for patient Cy2.

