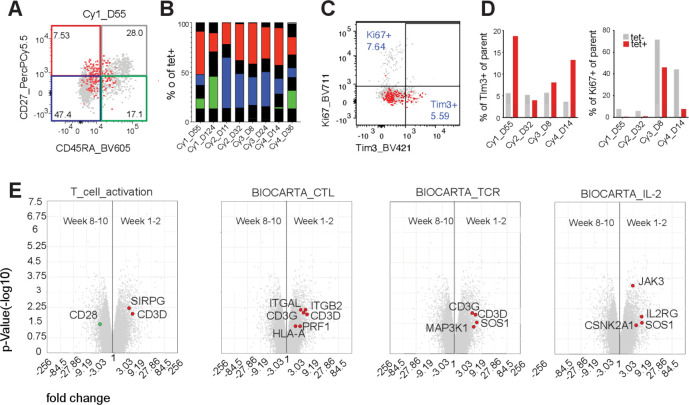
Figure 2.
Phenotype of persisting cells. (A) Representative plots for expression of CD45RA and CD27 on tet+ cells (red) overlaid on tet− cells (gray). (B) Bars show the distribution of tet+ cells into CD45RA–CD27– (blue), CD45RA+CD27– (gray), CD45RA+CD27– (green) and CD45RA–CD27+ (red). (C) Representative plots for expression of Tim3 and Ki67 expression from mid-range time points (weeks 3–8) post-infusion on tet+ cells (red) overlaid on tet– cells (gray). (D) Bars show percentage Tim-3+ and Ki67+ cells of parent for tet+ (red) and tet– (gray) CD8+ T cells. (E) Scatter plot of microarray data depicting genes differentially expressed between transferred NY-ESO-1–specific T cells isolated at an early time point (weeks 1–2) and late time point (weeks 8–10) post-infusion. Gene set analysis depicting genes that are overexpressed in early (red dots) vs late time (green dots) point samples and belong to pathways reflective of T-cell activation, cytotoxic killing, TCR activation and IL-2 signaling (left to right). All genes differentially expressed that belong to the indicated pathway are represented in colored circles.

