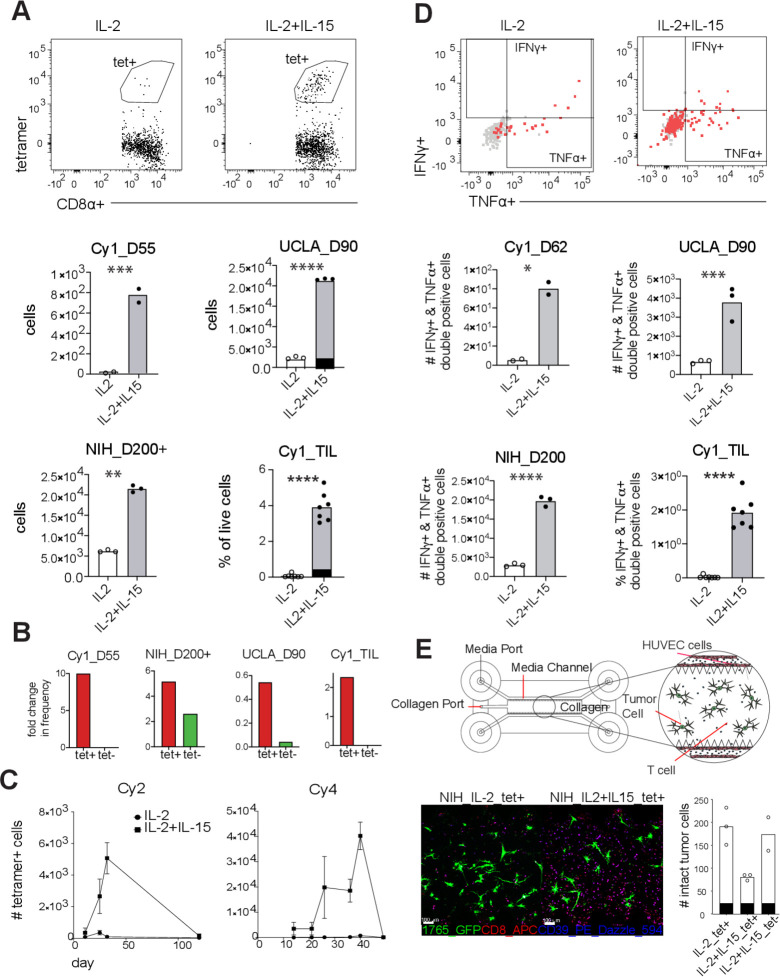
Figure 3.
IL-15 expands and revives cytotoxicity of NY-ESO1-1–specific T cells. Peripheral blood mononuclear cells (PBMCs) and tumor-infiltrating lymphocytes from patients after 9 days of culture with NY-ESO-1 peptide in conditioned media. (A) Representative gating of tet+ cells applied to live CD8+ cells, and number of tet+ cells or percentage of tet+ of live cells, in cultures supplemented with IL-2 (clear bars with clear dots) or IL-2 plus IL-15 (gray bars with black dots). Each dot represents one technical replicate. (B) Fold change in the mean frequency of tet+ cells (red bars) from day 0 (ex vivo) to day 9 post-culture in IL-2 plus IL-15. Fold change for tet− (green) bars in shown for reference. (C) Graph depicting the counts of tet+ cells in IL-2 (circles) or IL-2 plus IL-15 (squares) supplemented cultures started from PBMCs of 2 patients isolated at various recovery times. Squares and circles represent the mean derived from 2 to 3 replicates and bars show SD. (D) Representative flow cytometry plots depicting the production of IFNγ and TNFα by tet+ cells (red) overlaid on tet− cells (gray) for reference. Number of IFNγ and TNFα double-positive tet+ cells, or percentage of double-positive cells of live cells, in cultures supplemented with IL-2 (clear bars with clear dots) or IL-2 plus IL-15 (gray bars with black dots) are shown. As in (A), each dot represents one technical replicate. (E) Illustration of the design of organoid chips prepared to measure killing of 1765 (MRCL cell line) by CD8 T cells. PBMCs of patient from NIH trial cultured with NY-ESO-1 peptide and supplemented with IL-2 or IL-2 plus IL-15 for 7 days and tet+ and tet− cells were sorted and injected into organoid chips. Number of GFP+1765 cells were counted 48 hours post–T-cell injection. One dot represents one organoid chip. For all panels where relevant: ****p<0.0001, ***p<0.001, **p<0.01, *p<0.05.

