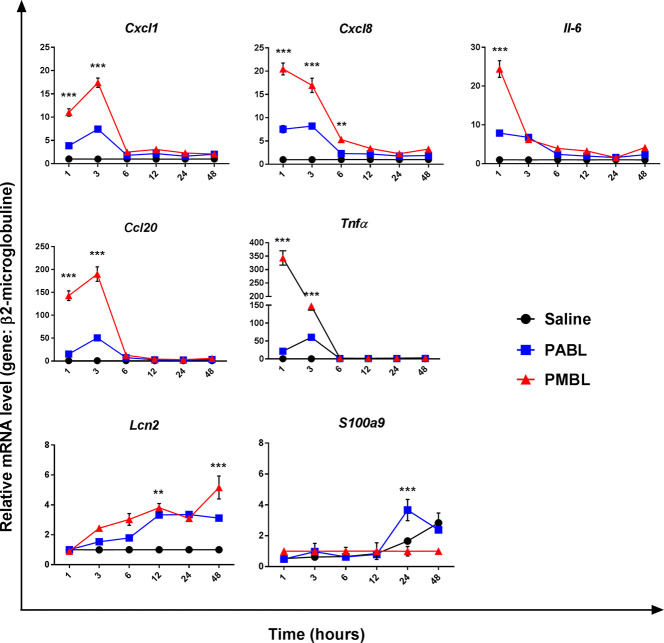
Figure 2.
Temporally kinetics of the transcriptional profile of the alveolar cell line (A549) in vitro stimulated with 10 μg/ml of either PABL or PMBL for 1, 3, 6, 12, 24 or 48 h. Relative mRNA levels of Ccl20, Cxcl1, Cxcl8, Tnfa, Il6 and Lipocalin 2 were assessed by RT-qPCRs. Data are expressed as fold increase of relative mRNA levels for each gene normalized against β2-microglobulin referred to non-stimulated cultures. Each point represents Mean ± SEM of quintuplicate cultures. Data are representative of three independent experiments. Significant differences between groups are indicated by **p < 0.01 and ***p < 0.001, two-way ANOVA with Bonferroni correction.

