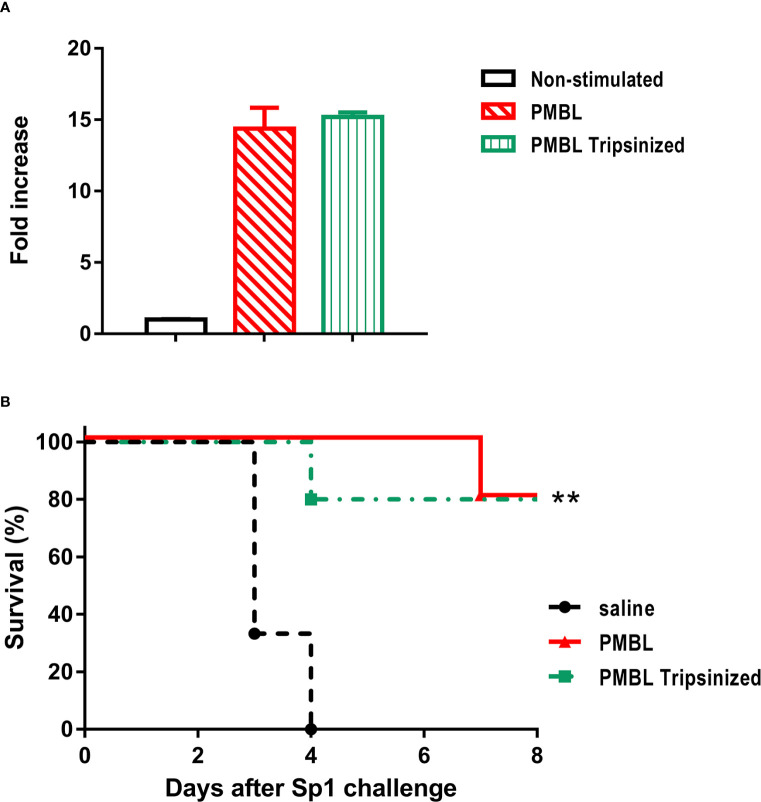
Figure 7.
(A) In vitro stimulation of Raw-Blue cells with equivalent amounts of PMBL (10 μg/ml) or trypsinized PMBL. Supernatants were taken 24 h later and SEAP reporter levels were measured by the QUANTI-Blue method (O.D.638). The bars represent Mean ± SEM of triplicate cultures for fold increase related to non-stimulated.Data are representative of three independent experiments. (B) Survival rates from lethal pneumonia challenge (Sp1) of mice (n=6) that were pretreated i.n. with same quantities (18 µg/30 µl) of PMBL and Trypsinized PMBL. All mice were challenged 24 hours later with the MLD of Sp1 (3x10⁶ CFU/50 µl). Survival rates for each group were recorded for 8 days. Significant differences are shown by **p < 0.001, treated vs. untreated, Log-rank test (Mantel-Cox). Data are representative of three independent experiments.

