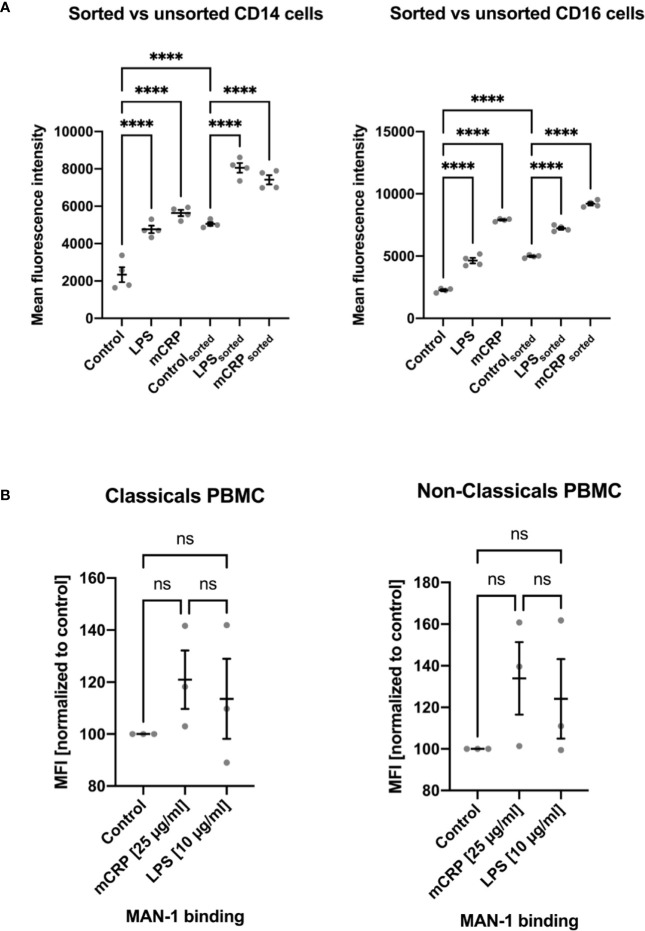
Figure 5.
Comparison of monocyte activation state in whole blood samples upon stimulation with PBS (control), mCRP, and LPS to activation states assessed after cell isolation via fluorescence-activated cell sorting (FACS; A) and density gradient centrifugation (PBMC; B). An increase in MAN-1 expression demonstrated cell activation. The MFI for MAN-1 of the respective control sample was set as 100. Both monocyte subtypes showed a marked upregulation of MAN-1 after cell isolation itself, especially following density gradient centrifugation (B). While FACS led to a moderate increase in cell activity, allowing the evaluation of monocytes’ activation state upon further stimulation (A), PBMC isolation resulted in an out of scale pre-activation of the cells that rendered further stimulation insignificant (B). ns, not significant; ****p < 0.0001.

