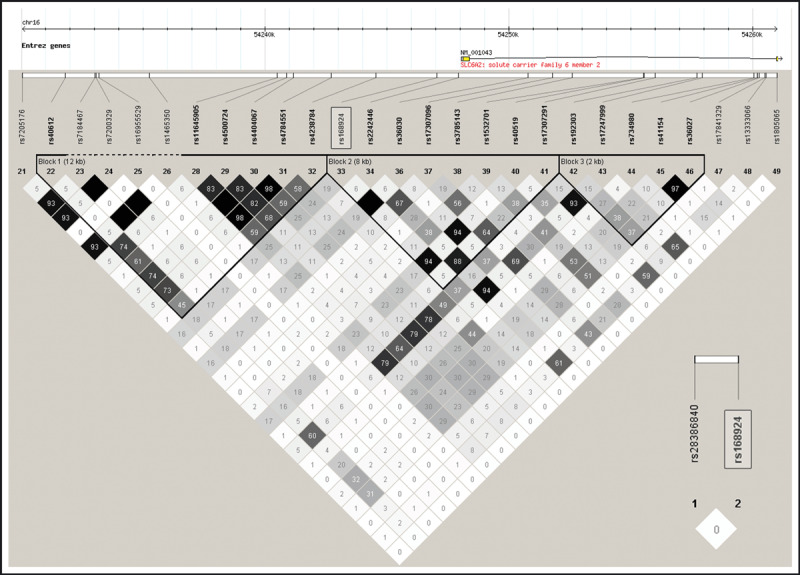
Figure 2.

Linkage disequilibrium across the region containing rs168924. Estimates of the square of the correlation coefficient (r 2) were calculated for each pairwise comparison of SNPs based on data from the HapMap‐CEU sample. Insert: Linkage disequilibrium between rs168924 and rs28386840 (r 2) based on data from our study cohort.
