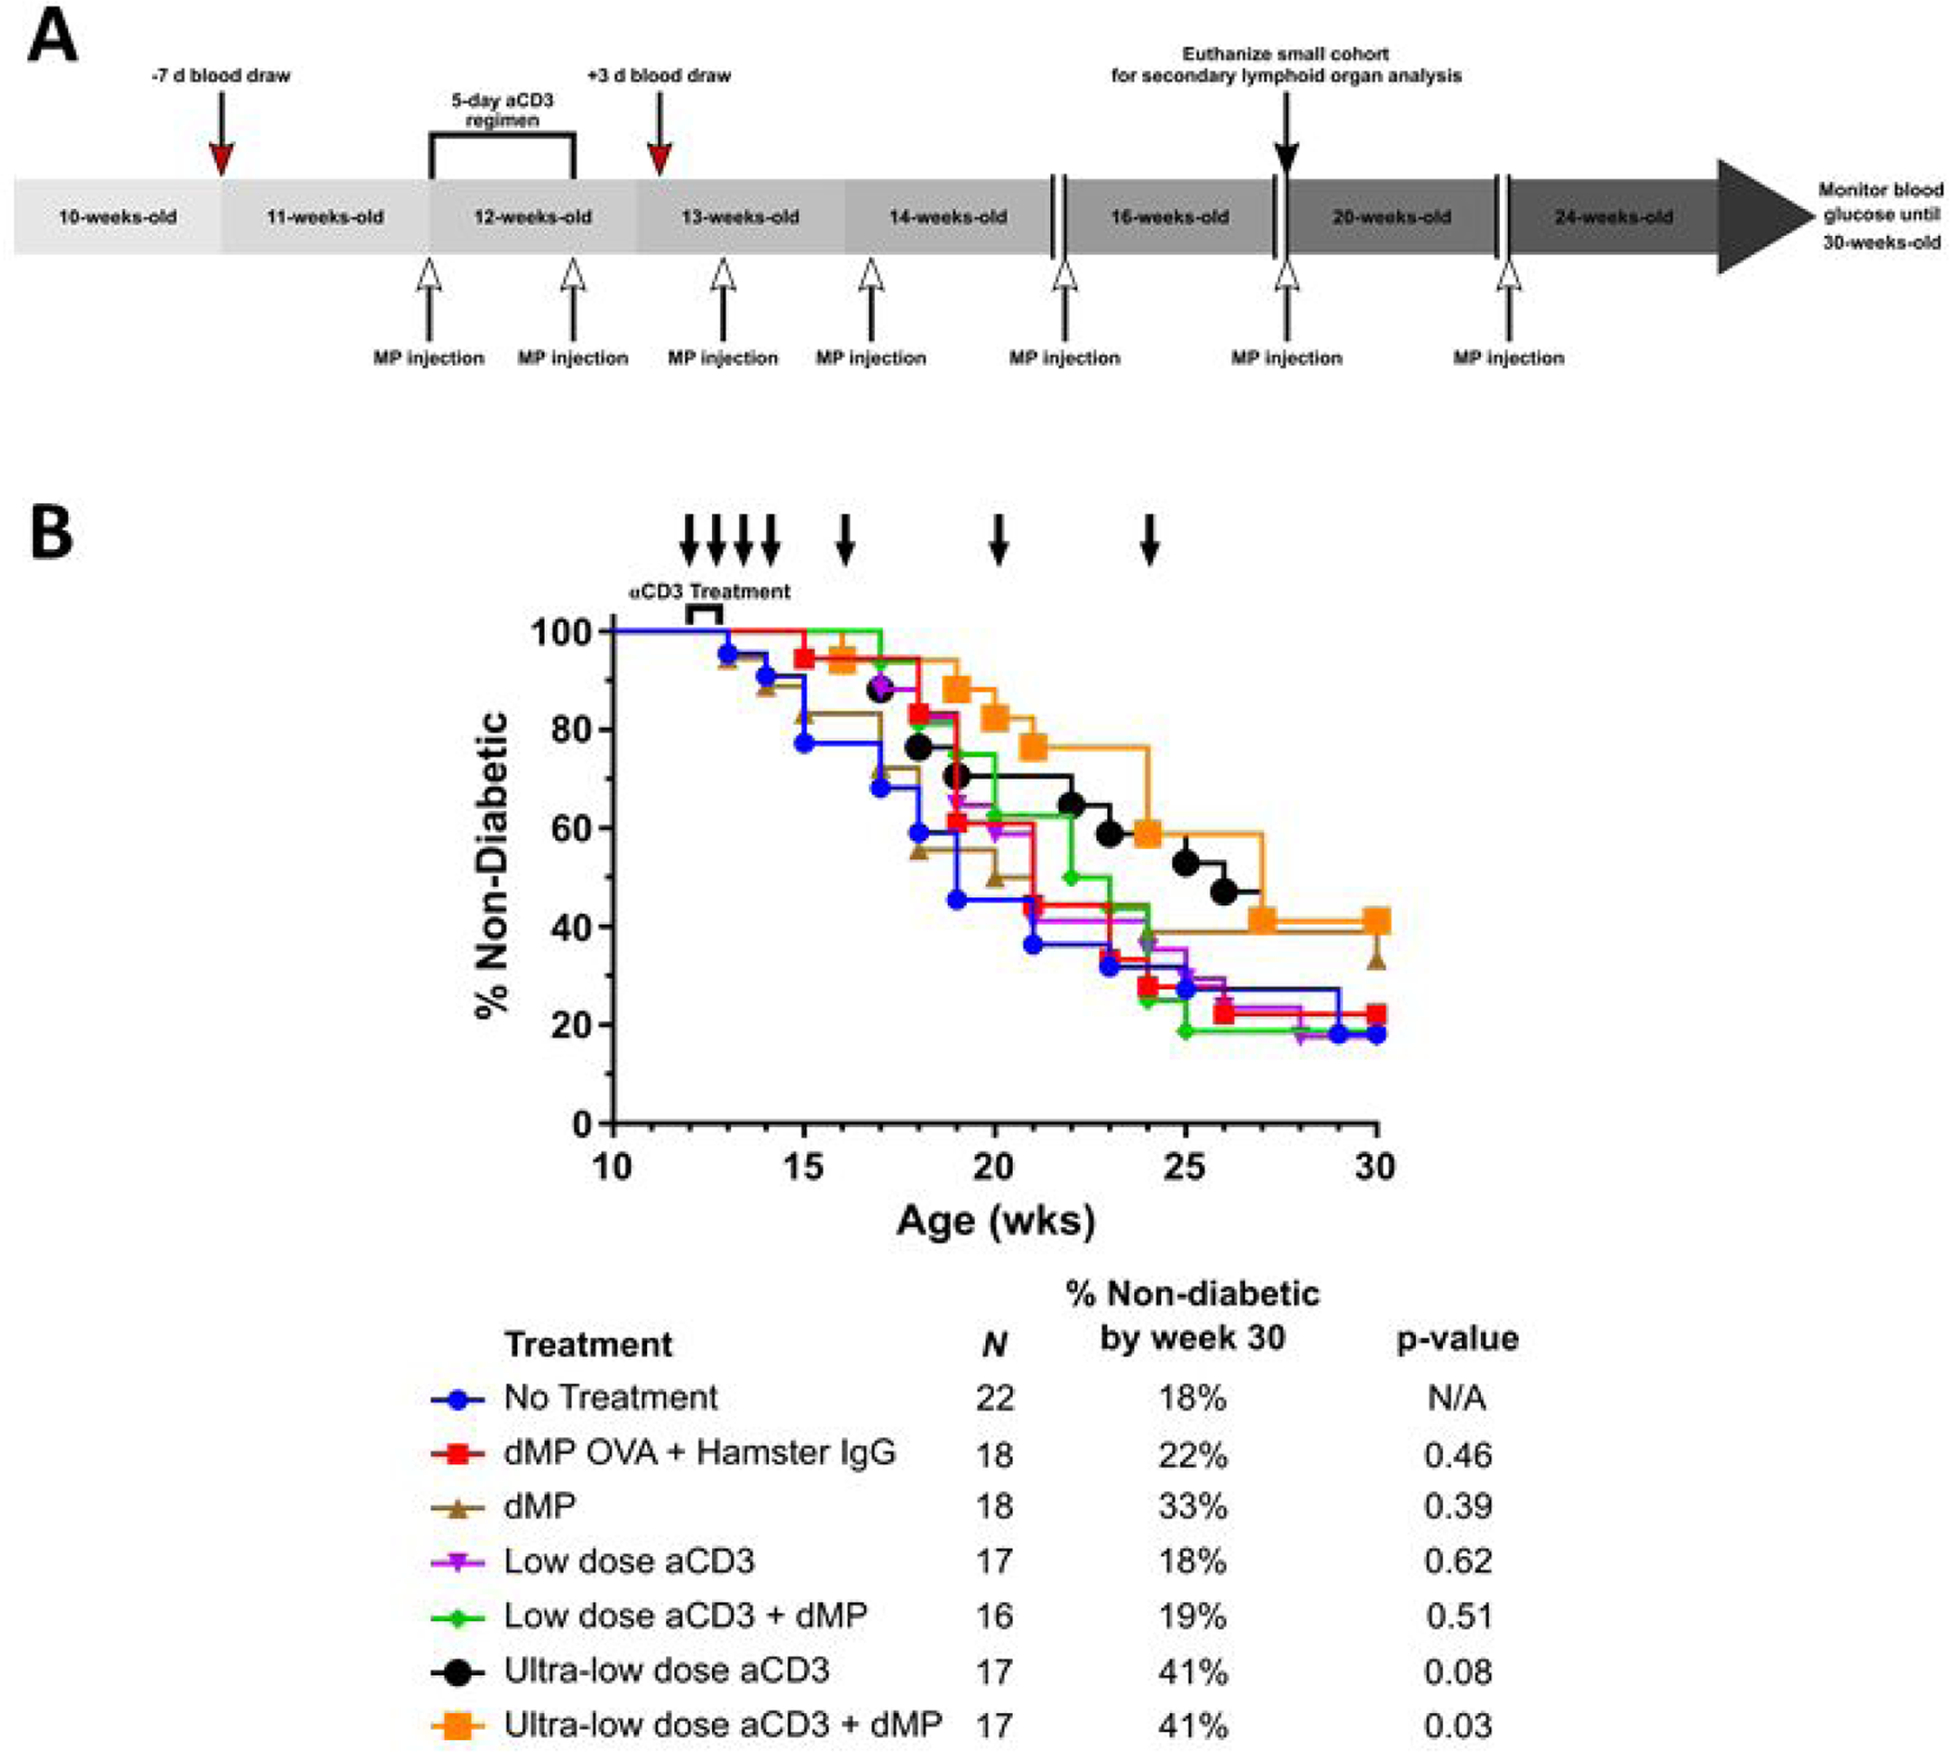
Figure 4. Treatment schedule for aCD3 and dMP combination therapy and diabetes incidence.

(A) A cohort of female NOD mice were randomized into seven treatment groups. Mice were monitored weekly for hyperglycemia beginning at 10-weeks-old and any diabetic animals (blood glucose levels were ≥ 240 mg/dL on two consecutive days) removed prior to study enrollment. At 11 weeks of age, a week before aCD3 and dMP treatment began, and three days after aCD3 treatment a selection of mice from each group was bled (red arrows) to assess circulating blood leukocyte frequencies and phenotype. At 12 weeks of age, mice began aCD3 treatment and/or received MP injections (white arrows). Animals received either PBS, control IgG F(ab)2 fragments (5 μg/day), low-dose aCD3 (5 μg/day), or ultra-low-dose aCD3 (1 μg/day) i.p. for five consecutive days. Simultaneously, beginning at 12 weeks of age, mice were subcutaneously injected with either PBS, dMP OVA, or the dMP every five days for a total of four initial MP injections. Subsequently mice received three monthly booster dMP injections at 16-, 20-, and 24-weeks-old. A small cohort of animals excluded from Kaplan-Meier survival analysis were euthanized at 20 weeks of age (black arrow) to analyze secondary lymphoid organs. Weekly blood glucose measurements continued up to 30 weeks of age, after which remaining non-diabetic mice were euthanized, and mice were considered diabetic when blood glucose levels were ≥ 240 mg/dL on two consecutive days. (B) dMP treatment failed to synergize with aCD3 to improve diabetes prevention in 12-week-old NOD mice.. Survival data is fit using the Kaplan–Meier non-parametric survival analysis model and statistical analysis performed via log-rank test (Mantel-Cox method). Descriptive characteristics for each treatment group highlight the n per group, percent of mice non-diabetic by the end of study, and unadjusted p-value as compared to the no treatment group. Statistical significance was not realized when accounting for multiple comparisons via Bonferroni correction, as the study was not powered to resolve this large number of groups. However, pairwise comparison between survival curves of mice that received the ultra-low-dose aCD3 + dMP and untreated mice resulted in a p-value < 0.05, suggesting a difference between treatments.
