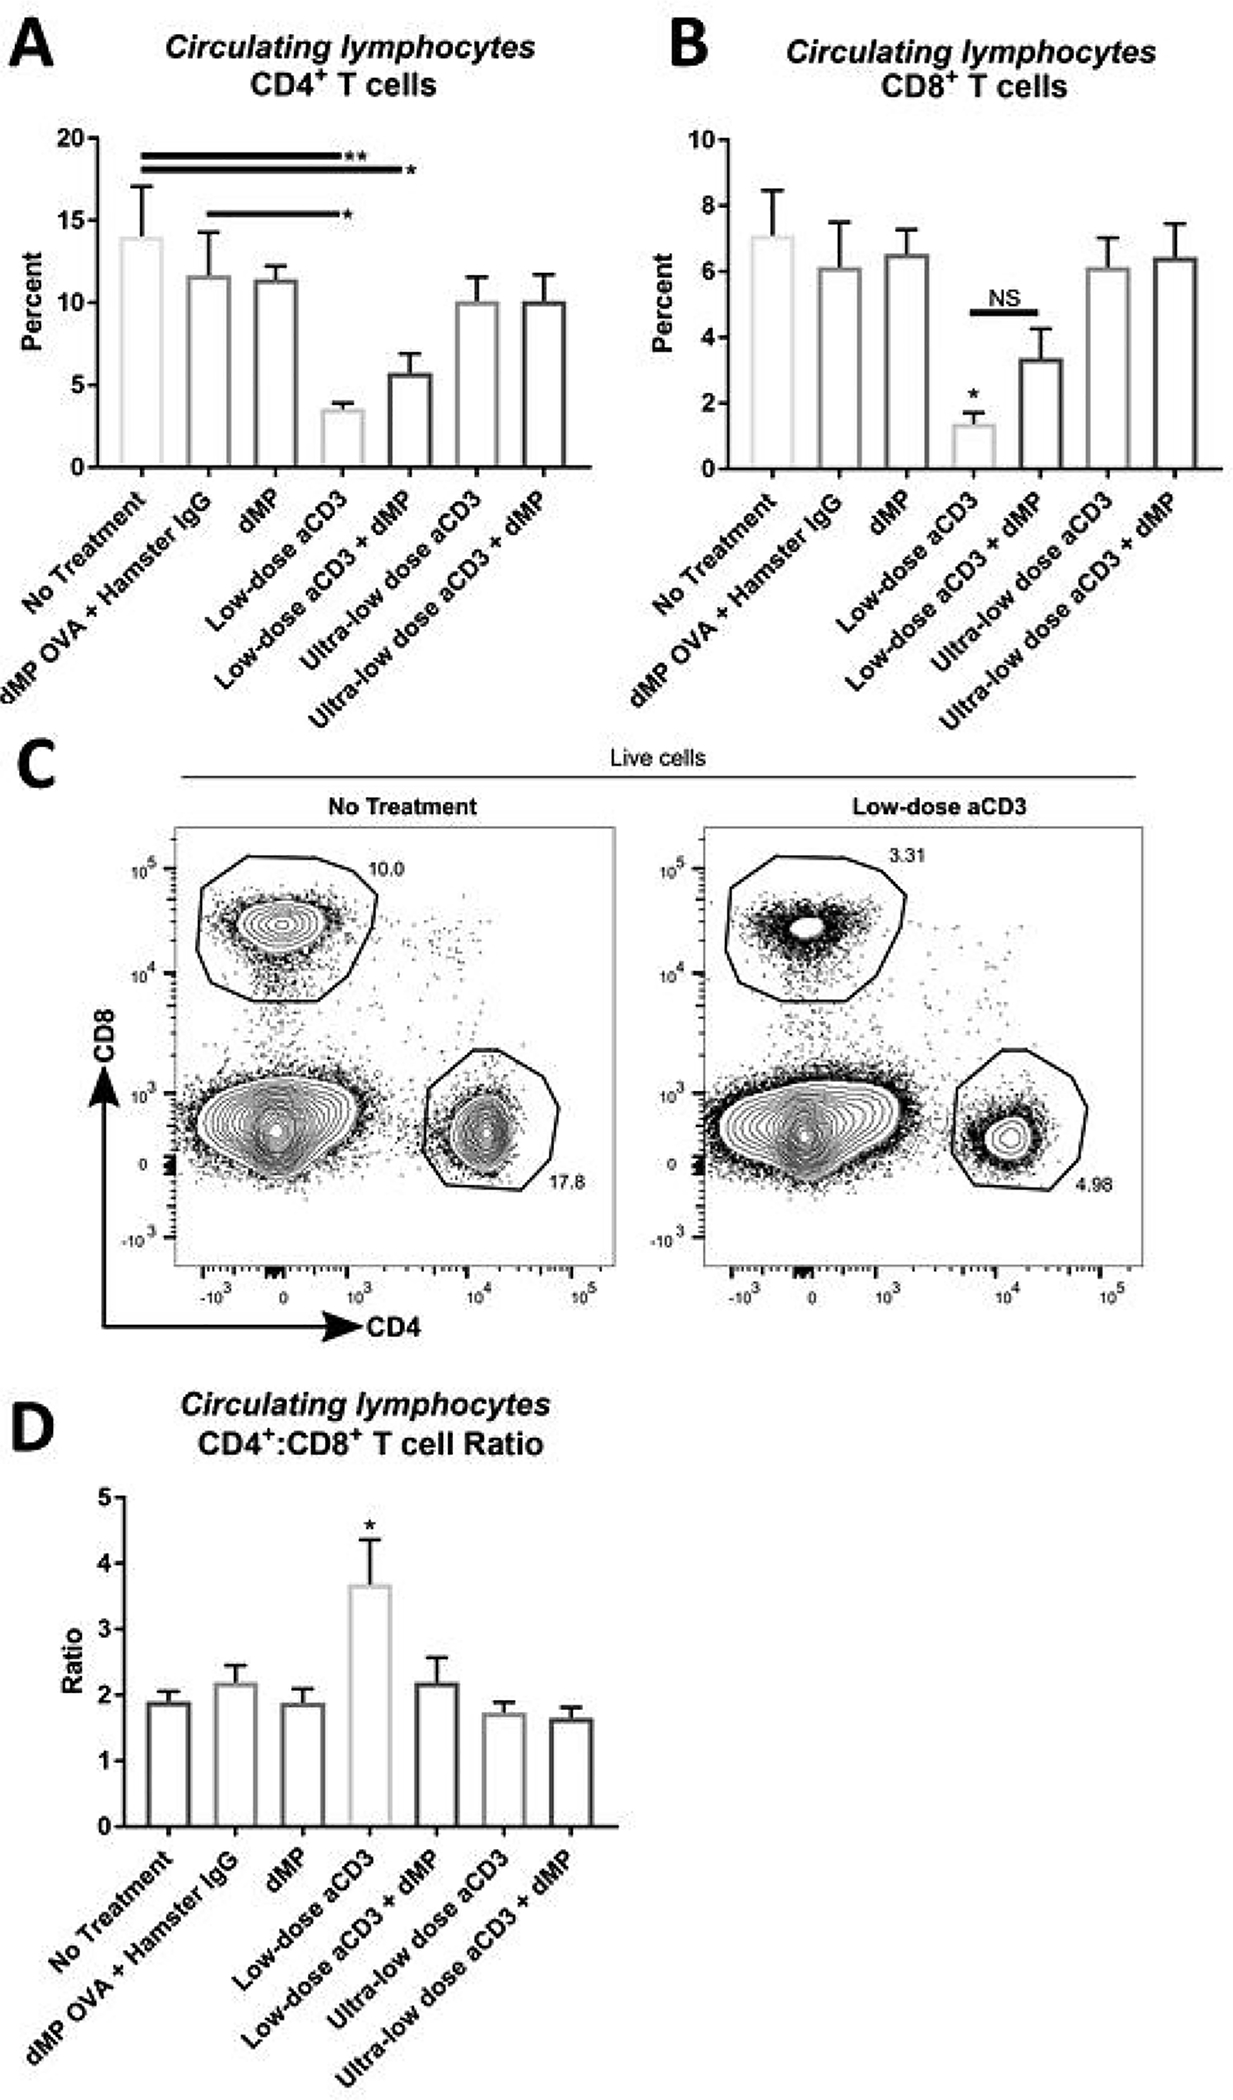
Figure 5. Circulating T cell frequencies were reduced in low-dose aCD3 treated mice.

At ~13 weeks of age, three days after completing a five-day aCD3 treatment regimen, a selection of mice from each group was bled to assess circulating blood lymphocyte frequencies (n = 9–10/group). Frequency of (A) CD4+ and (B) CD8+ T cells in blood was determined by flow cytometry. (C) Representative flow analysis. (D) CD4+ to CD8+ T cell ratio. P-values (* ≤ 0.05, ** ≤ 0.01) were determined by one-way ANOVA with Tukey’s significance test. Significance (*) in (B) reflects low-dose aCD3 is significant against every group except low-dose aCD3 + dMP (NS; non-significant). Significance in (D) reflects low-dose aCD3 is significant against every other treatment group. Data is represented by mean ± SEM. Full gating scheme – see Supplemental Figure 9.
