
Figure 2.
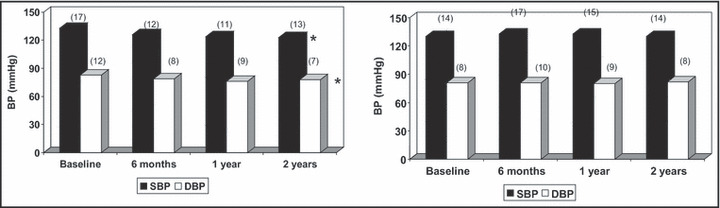
Systolic and diastolic blood pressure in 59 patients in the educational care (EC) group (on the left) and 56 in the usual care (UC) group (on the right) who completed the 2‐year follow‐up, at baseline and during the observation period. Significance vs baseline: *P<.001.