
Figure 3.
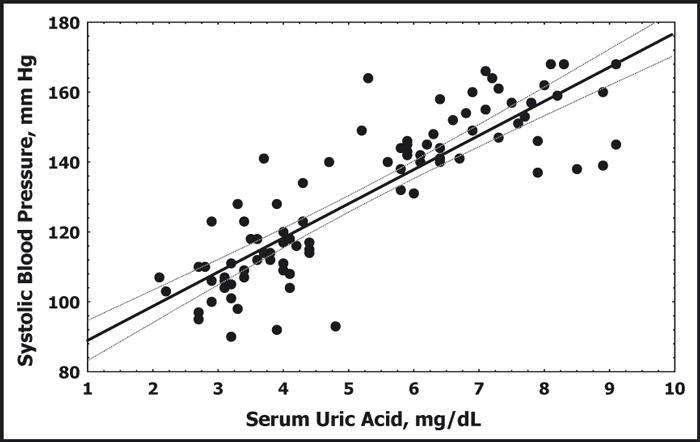
Serum uric acid is plotted against systolic blood pressure for children with normal blood pressure and children with primary hypertension. Data do not include individuals with secondary hypertension or white‐coat hypertension. The solid and dotted lines represent the best fit and 95% confidence intervals, respectively, and demonstrate the linear relation between uric acid and systolic blood pressure.54