
Figure 2.
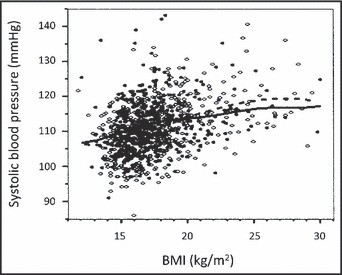
Correlation between body mass index (BMI) and mean systolic blood pressure (Spearman’s r=0.34, P≤.001). The open circles and dashed line represent girls and the black dots and solid line represent boys. The lines indicate fit by nonparametric smoothing.