Figure FIGURE.

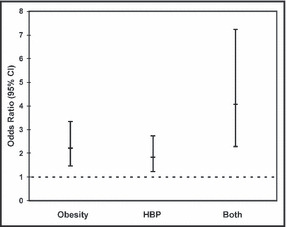
The odds ratio for abnormal glucose tolerance, represented by the small square, and 95% confidence interval (CI), represented by the vertical line, is depicted for obesity alone, for high blood pressure (HBP) alone, and for both obesity and high blood pressure.
