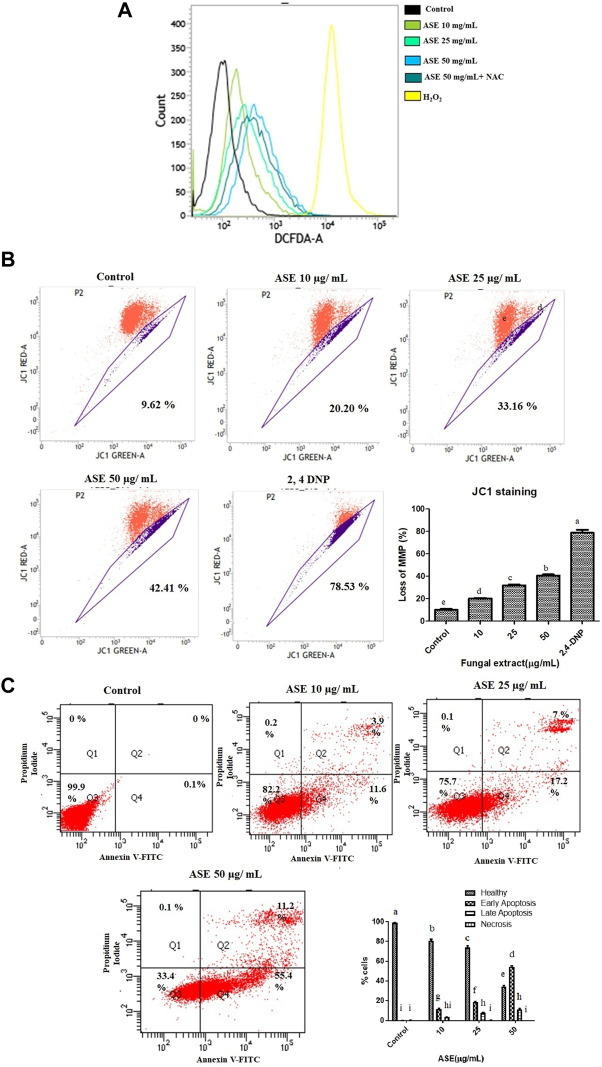
FIGURE 8.
Effect of ASE on HeLa cell apoptosis. (A) Effect of ASE on ROS production. Intracellular ROS was detected by DCFH-DA dye after cells were treated with ASE by flow cytometry. Overlay graph presents as fold values using graphs compared with control. (B) Effect of ASE on mitochondrial membrane depolarization. Cells treatment was with different concentrations of ASE for 24 h and then they were stained with JC-1 which detects depolarization of mitochondrial membrane by using flow cytometry. The percentage of ASE-treated cells showing the increase in mitochondrial membrane depolarization in a dosage-dependent manner was shown in a bar diagram; cells treated with 2,4-dinitrophenol (2,4-DNP) served as positive control. (C) Apoptosis (PS externalization) determined by propidium iodide uptake and binding Annexin V to phosphatidylserine of by flow cytometry analysis. It shows four group of cells, cells that were negative for Annexin-V and propidium iodide were normal healthy (Quadrant 3); cells that were positive to Annexin-V were early apoptotic (Quadrant 4); cells positive both Annexin V and PI were late apoptotic (Quadrant 2); and cells that only stained with PI were necrotic or dead (Quadrant 1). ASE with an indicative concentration was treated against HeLa cells for 24 h. The distribution of normal healthy, early apoptotic, late apoptotic, and necrotic cell populations was represented in a bar diagram. Means sharing different letters differ significantly from each other at p ≤ 0.05.9. Effect of ASE on Caspase 3, 7, and 10 activity of Hela cells. Different concentrations of fungal crude extracts were treated to cells for 48 h and caspase 3, 7, 10 activity was determined by Caspase 3, 7,10 Apoptosis fluorometric Assay Kit. Means sharing different letters differ significantly from each other at p ≤ 0.05.

