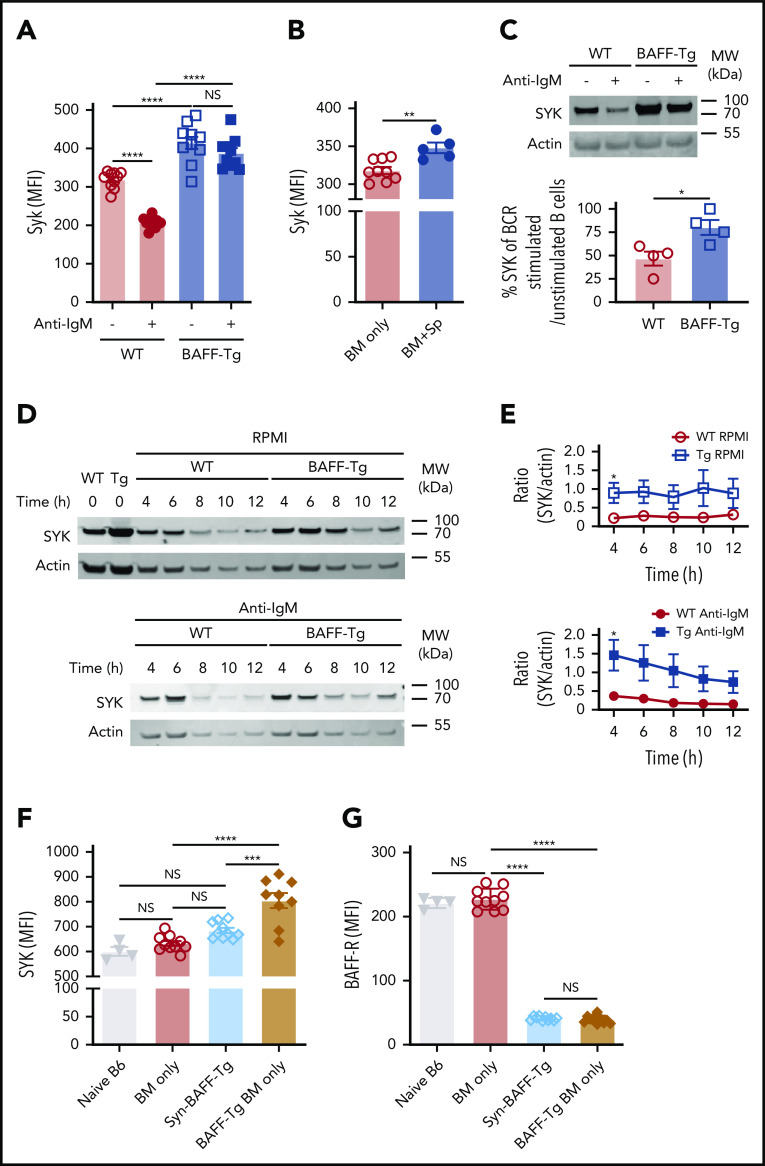
Figure 6.
B cells from mice with cGVHD manifestations maintain high levels of the proximal BCR signaling protein SYK after ex vivo BCR engagement. (A) SYK protein expression level after BCR engagement. Blood B cells from WT or BAFF Tg mice were left as resting or stimulated with anti-IgM (10 µg/mL) overnight (18 hours). Expression of SYK was assessed by intracellular staining and flow cytometric analysis, with pregating on Zombie−B220+ cells; n = 10 of each group. (B) Intracellular staining for SYK protein levels in blood B cells of BM only and BM + Sp mice determined at day 66 post-BMT using flow cytometry. We pregated on Zombie−B220+ live B cells, and median fluorescence intensity (MFI) was used to determine relative expression of SYK protein. Results shown are a representative of 3 repeats; n = 9 (BM only) and n = 5 (BM + Sp). (C) Percentage of normalized BCR-stimulated SYK to unstimulated SYK. Representative SYK protein by western blot before and after BCR stimulation with anti-IgM (10 µg/mL) in purified splenic B cells from a WT mouse compared with a BAFF Tg mouse (upper panels). Western blot was repeated 4 times. Intensity of SYK and actin bands on the western blots was analyzed using Image Studio Lite software. Intensity of SYK was normalized to intensity of actin. Percentage of normalized BCR-stimulated SYK to unstimulated SYK is shown in the graph (bottom panel); n = 4 of each group. (D) Cycloheximide chase assay to assess SYK protein stability in B cells from WT vs BAFF Tg mice. Purified splenic B cells from WT or BAFF Tg mice were first treated with cycloheximide (10 µg/mL) overnight (18 hours) to stop protein synthesis. B cells were then left as resting (top panels) or stimulated with anti-IgM (10 µg/mL, bottom panels) for different time points before SYK and actin were assessed by western blot. Western blot result is a representative experiment from 5 repeats. (E) SYK protein over time without (top) or after (bottom) BCR stimulation in B cells taken from WT vs BAFF-overexpressing (Tg) mice. Intensity of SYK and actin from western blot data was determined using Image Studio Lite software for unstimulated cells (top panel) and anti-IgM stimulated cells (bottom panel) over time. SYK/actin ratio was calculated and is shown in panel E; n = 5 of each group. (F) Intracellular SYK protein levels in peripheral blood B cells from nontransplanted naïve mice or recipients of T cell–depleted WT allo-BMT (BM only), Syn BAFF Tg BM only vs BAFF Tg BM only at day 159 after allo-BMT. Fixed and permeabilized peripheral blood mononuclear cells were stained intracellularly and analyzed by flow cytometry, with pregating on Zombie−B220+ B cells, and MFI was used to represent the relative amounts of SYK protein; n = 9 (BAFF Tg BM only), n = 10 (WT BM only or Syn group), and n = 4 (naïve B6 mice). (G) Comparison of cell surface BAFF-R expression on blood B cells taken from WT BM only, BAFF Tg BM only, or BAFF Tg Syn BMT mice on day 137. BAFF-R staining of B cells from nontransplanted naïve B6 mice is shown on the far left for reference. MFI of BAFF-R was determined after gating on live Zombie−CD19+ B cells; n = 10 each group (WT BM only, BAFF Tg BM only, or BAFF Tg Syn) and n = 4 (naïve B6). Statistical analysis was performed by ordinary 1-way analysis of variance with Tukey’s multiple comparisons test (A,F-G), unpaired Student t test with Welch’s correction (B), Mann-Whitney test (C), or multiple Student t tests with few assumptions (E) using GraphPad Prism 8 software. *P < .05, **P < .01, ***P < .001, ****P < .0001. MW, molecular weight; NS, not significant (P > .05).

