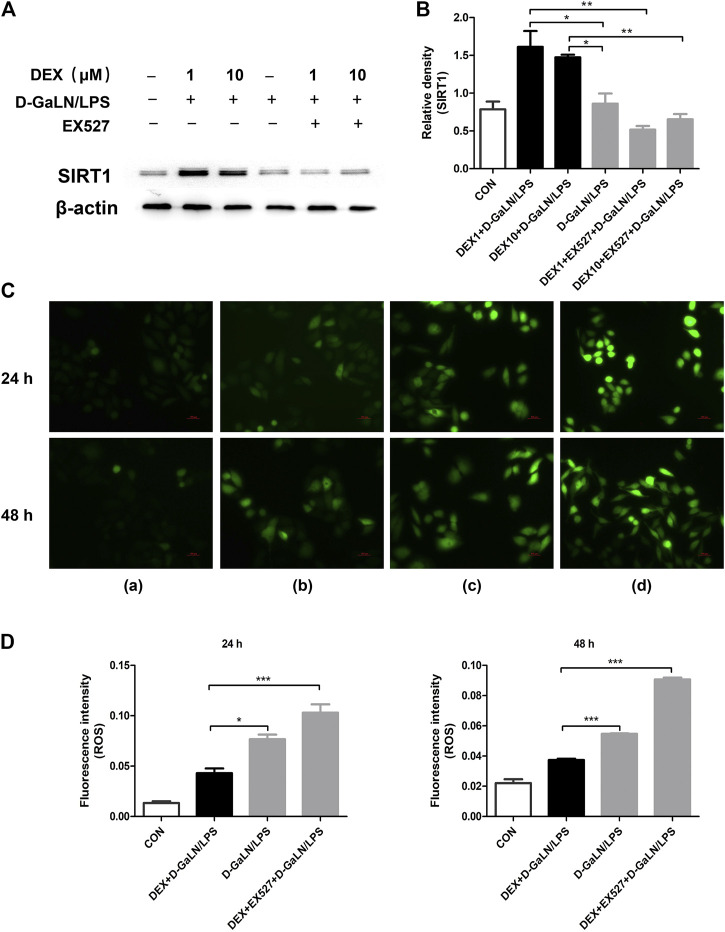
FIGURE 6.
DEX reduced D-GalN/LPS-induced ROS production could reversed by EX527. (A) The protein expression of SIRT1 in L-02 cells, as determined using western blotting. (B) Densitometric analysis of SIRT1 from (A). (C) Intracellular ROS level determination. (C) and the quantitative results (D). (A): Control group; (B): DEX + D-GalN/LPS group (DEX: 1 μM, D-GalN: 10 mM, LPS: 10 ng/ml); (C): D-GalN/LPS group (D-GalN: 10 mM, LPS: 10 ng/ml); (D): DEX + EX527+D-GalN/LPS group (DEX: 1 μM, EX527: 10 μM, D-GalN: 10 mM, LPS: 10 ng/ml). Error bars on the bar graphs represent the mean ± SD. *p < 0.05, **p < 0.01, ***p < 0.001.

