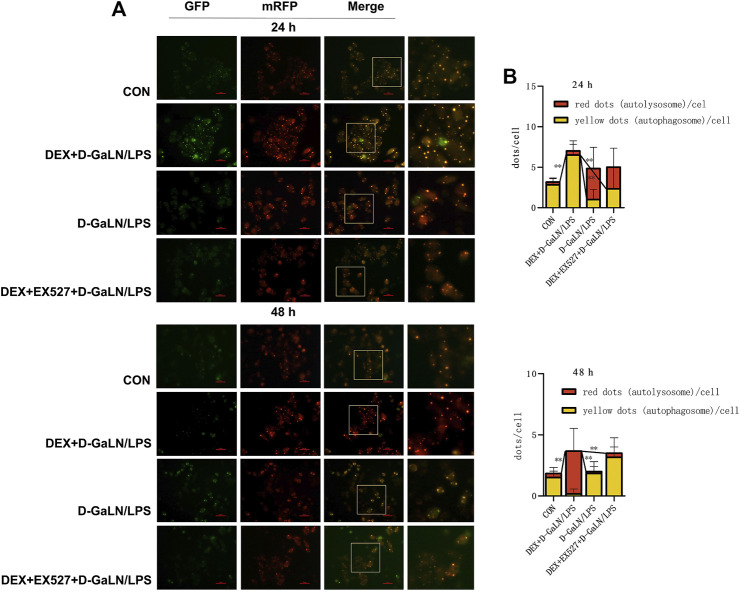
FIGURE 7.
EX527 inhibited DEX-induced autophagy flux in D-GalN/LPS-treated L-02 hepatocytes. (A) Fluorescence images of the mRFP-GFP-LC3 in L-02 cells showing the autophagy flux at the indicated time points. (B) Mean number of autophagosomes (yellow puncta in the merged images) and autolysosomes (red puncta in the merged images) per cell. Error bars on the bar graphs represent the mean ± SD. **p < 0.01.

