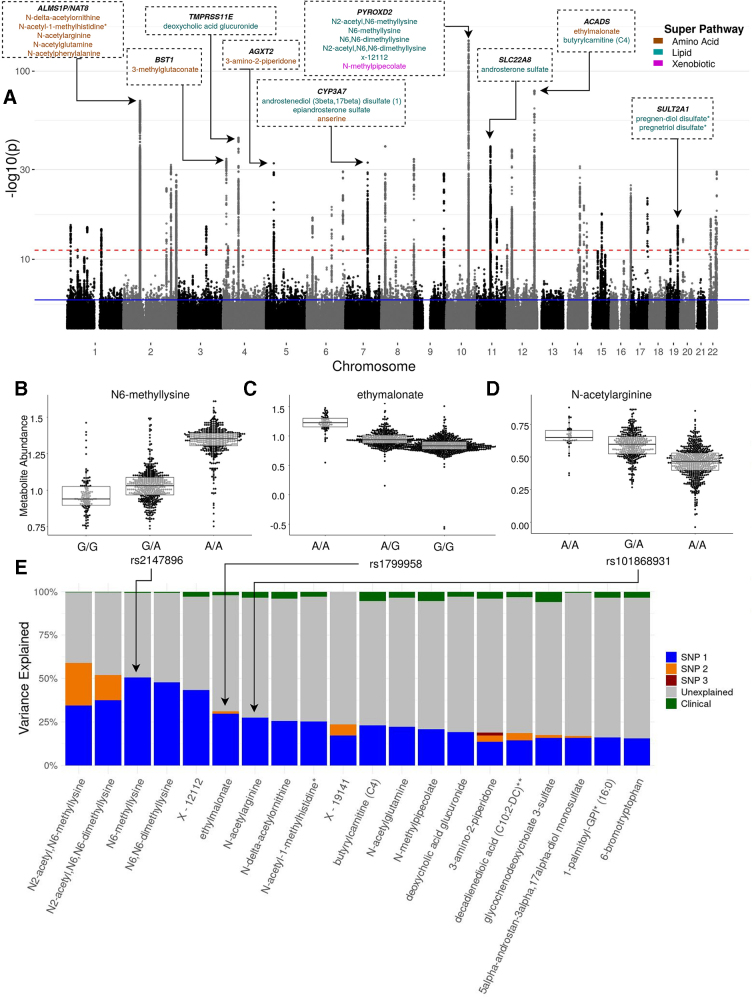
FIG. 2.
Genome-wide associations between SNPs and metabolites. (A) Discovery mWAS Manhattan plot showing −log10 p-values from mWAS tests. The blue and red dashed lines indicate false discovery rate and Bonferroni significance, respectively. Loci in which >20% of the metabolite variance is explained by a single SNP are labeled by nearest gene and metabolites affected. Metabolite text colors coded by Super Pathway. (B–D) Bee swarms of inverse normal transformed metabolite abundances by genotype for metabolites of different subpathways with the greatest variance explained by one SNP. Overlayed box plots represent the median and interquartile range of transformed metabolite abundance. (E) Bar plot of the percent variation for metabolites explained by clinical (green), top mQTL SNP (blue), the second independent mQTL SNP (orange), and any more independent mQTL SNPs (red). The gray indicates unknown variance. Clinical factors include age, sex, BMI, smoking status, smoking pack-years, and clinical center. BMI, body mass index; mWAS, metabolome-wide association study; SNPs, single-nucleotide polymorphisms.

