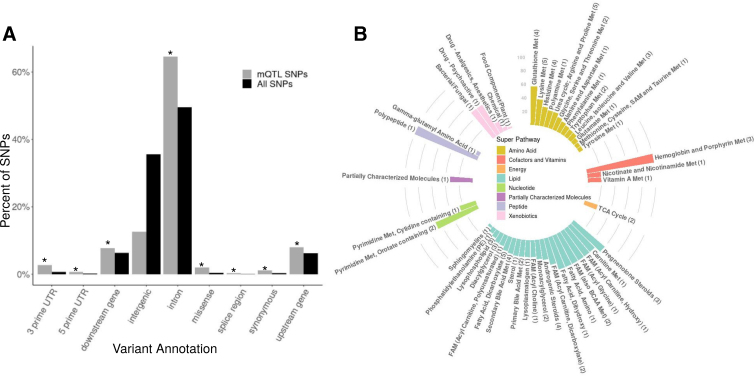
FIG. 3.
mQTL SNP enrichment analyses. (A) A bar plot showing the percentage by variant annotation of mQTL SNPs (black) and all SNPs tested (black). *Variant annotations significantly enriched in mQTLs. (B) A circular bar plot showing the percentage of each subpathway with at least one independent mQTL. The bars are colored by super pathway and labeled by subpathway, with the total number of metabolites in the subpathway with an mQTL in parentheses. FAM, fatty acid metabolism; Met, metabolism.

