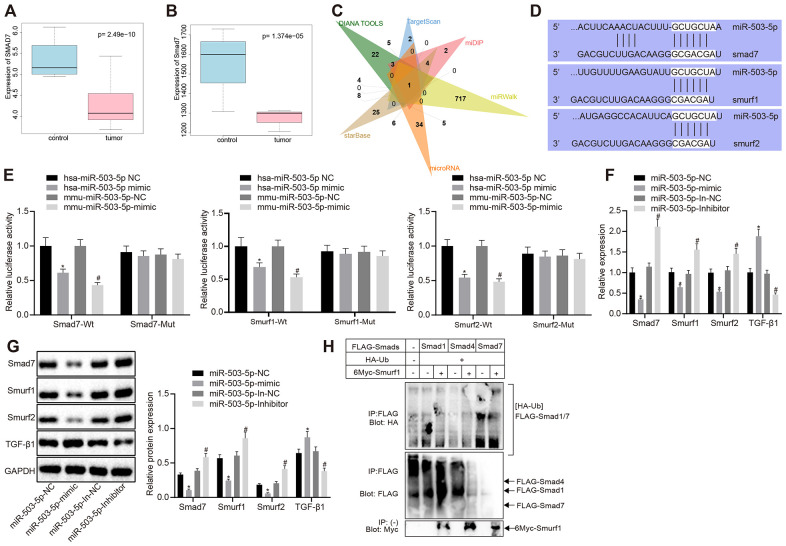
Figure 3.
miR-503-5p negatively regulates expression of smad7 and smurf1/smurf2 and reduces the ubiquitination of TGF-β1 receptor. (A) Box plots of smad7 expression in human atherosclerosis-related microarray data GSE9490 consisted of 4 normal samples without DL-homocysteine and 8 DL-homocysteine-induced atherosclerosis samples. The blue box on the left indicates the smad7 expression of normal samples, while the red box on the right indicates the smad7 expression of diseased samples. (B) Box plots of smad7 expression in mouse atherosclerosis-related microarray data GSE2372. There were 3 samples obtained from the WT mice and 3 samples from ApoE mice with atherosclerosis. The blue box on the left indicates the smad7 expression in normal samples, while the red box on the right indicates the smad7 expression in diseased samples. (C) Venn map of predicted upstream miRNAs of smad7 in the DIANA TOOLS (miTG score > 0.90; http://diana.imis.athena-innovation.gr/DianaTools/index.php), TargetScan (context++ score percentile ≥ 99; http://www.targetscan.org/vert_71/), miDIP (Integrated Score > 0.60; http://ophid.utoronto.ca/mirDIP/), miRWalk (|energy| ≥ 25; http://mirwalk.umm.uni-heidelberg.de/), microRNA, and starBase (pancancerNum ≥ 5; http://starbase.sysu.edu.cn/). (D) Prediction binding site of miR-503-5p in smad7, smurf1, and smurf2 3'-UTR analyzed by TargetScan software. (E) Detection of luciferase activity using dual-luciferase reporter gene assay. In panels (F–H), HCAECs were treated with exogenous miR-503-5p mimic (with miR-mimic NC as control) or exogenous miR-503-5p inhibitor (with miR-inhibitor NC as control). (F) The mRNA levels of TGF-β1, smad7, smurf1, and smurf2 (normalized to GAPDH) in HCAECs determined by RT-qPCR. (G) Protein levels of TGF-β1, smad7, smurf1, and smurf2 (normalized to GAPDH) in HCAECs determined by Western blot analysis. (H) Effects of Smad7 on the ubiquitination of TGF-β 1 by Smurf1 and Smurf2 detected by IP assay. Values obtained from three independent experiments in triplicate were analyzed by one-way ANOVA followed by Tukey's post hoc test among three or more groups. *p < 0.05 compared with HCAECs or HCASMCs treated with miR-mimic NC; *p < 0.05 compared with HCAECs or HCASMCs treated with miR-inhibitor NC.

