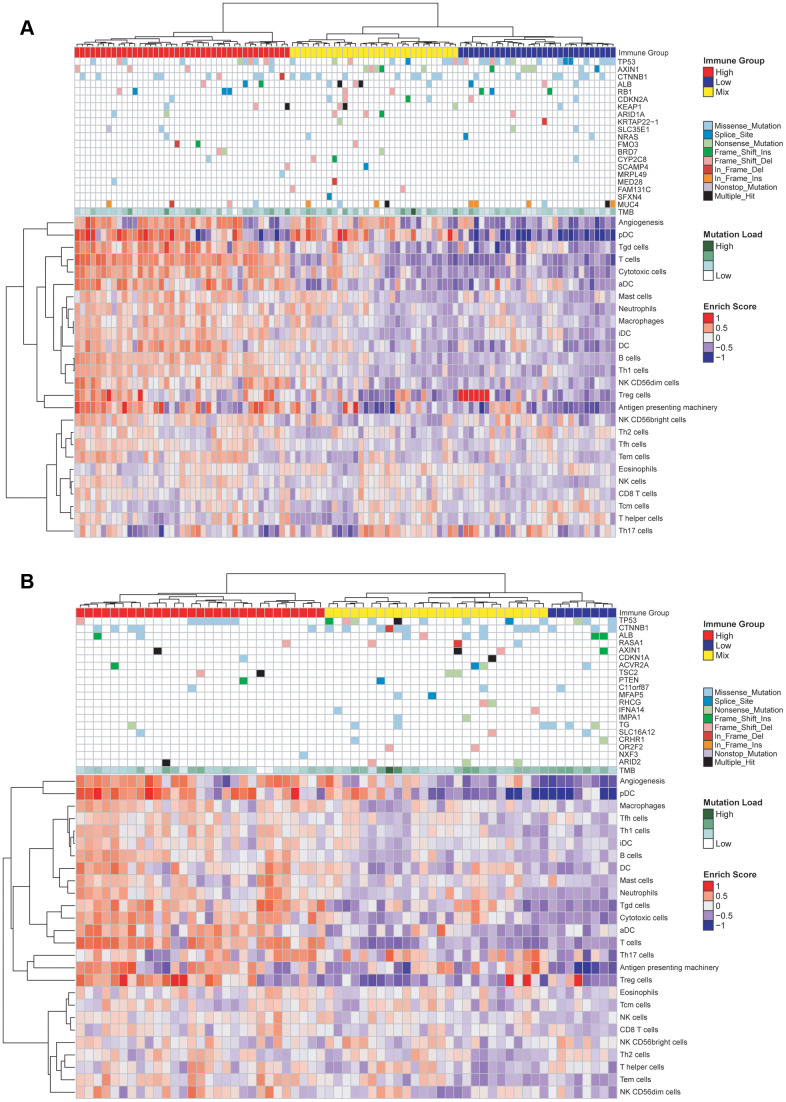
Figure 4.
Characterization of immune infiltration and gene mutations in the TCGA-HBV-HCC and TCGA-Alcol-HCC groups. (A) Heat map shown the normalized GSVA score, tumor mutation burden (TMB) and the most common 20 mutation genes in the TCGA-HBV-HCC group. (B) Heat map shown the normalized GSVA score, TMB and the most common 20 mutation genes in the TCGA-Alcol-HCC group. Samples were labeled using 4 types of data: (1) Immune status (red, yellow, and blue for HIGH, MIX, and LOW); (2) Mutation burden for each sample (green); (3) The most commonly 20 mutated genes in each subtype. Mutation types including 9 types represented in different colors; (4) Enrichment score.

