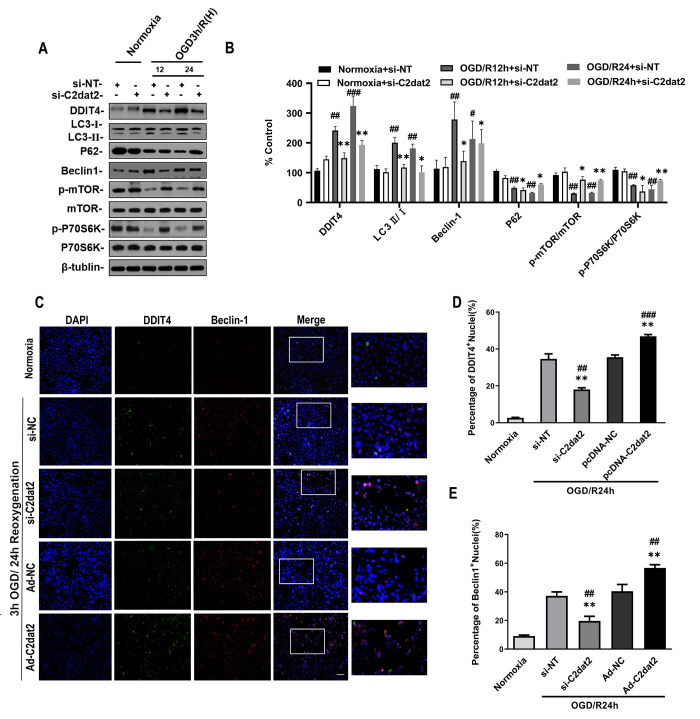
Figure 4.
Effect of C2dat2 down-regulation on autophagy in N2a cells after OGD/R. (A) Relative protein expression levels of DDIT4, LC3, P62, Beclin-1, p-mTOR, mTOR, p-P70S6K, and P70S6K were assessed using Western blotting of N2a cells transfected with si-NC or si-C2dat2 12 and 24 h after OGD/R. (B) Relative protein levels were analyzed. Data are mean ± SEM (n = 3). β-Tubulin was blotted as a loading control. (C) Representative images of double immunofluorescent staining of N2a cells with DDIT4 (green) and Beclin-1 (red). (D and E) DDIT4 and Beclin-1 expression was examined using immunofluorescence assay. Data are mean ± SEM. *P < 0.05; **P < 0.01 vs. normoxia; #P < 0.05; ## P < 0.01 vs. si-NT or pcDNA-NC subjected to the same OGD/R (n = 3 per group).

