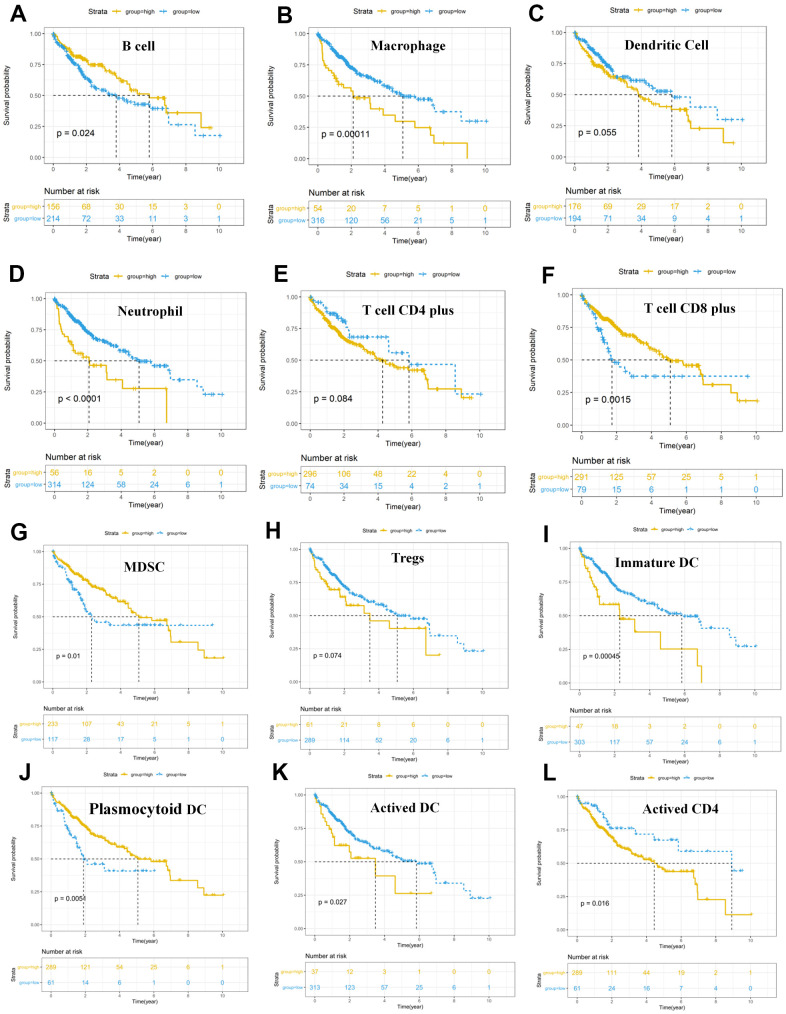
Figure 8.
Survival analysis of immune cells based on the TIMER database. Horizontal and vertical axes represent survival times and survival rates, respectively. Yellow and blue curves are samples with higher and lower immune cell fractions, respectively. (A–L) Lower infiltration levels of macrophages (B), dendritic cells (C), and neutrophil (D), CD4+ T cells (E), Tregs (H), Immature DC (I), Activated DC (K) and Activated CD4 (L) with improved survival outcomes, and higher infiltration levels of B cells (A), CD8+ T cells (F), MDSC (G) and Plasmocytoid DC (J) were associated with poor survival outcomes in HCC. HCC, hepatocellular carcinoma; TIMER, Tumor Immune Estimation Resource; Tregs, T cells regulatory; MDSC, myeloid-derived suppressor cells.

