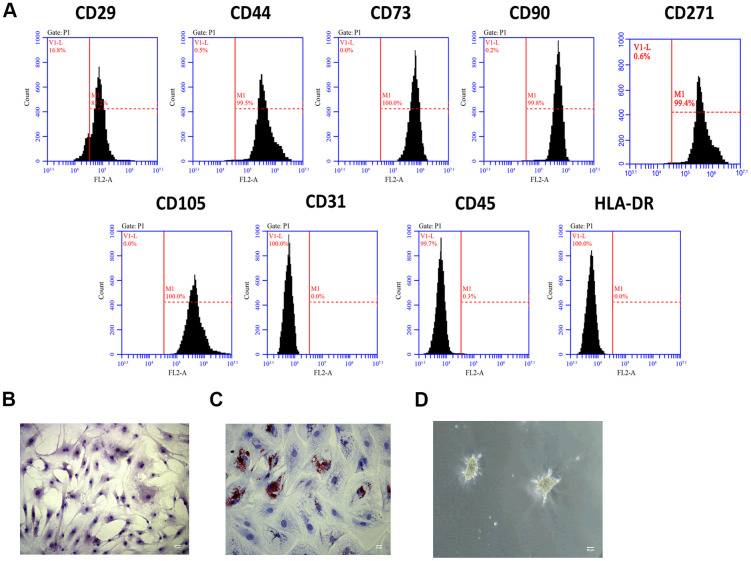
Figure 1.
MSCs identification. (A) Detection of stem cell markers by flow cytometer. MSCs positively expressed CD29, CD44, CD73, CD90, CD271 and CD105, while negatively expressed CD31, CD45, and HLA-DR. (B) Morphology of MSCs under an inverted microscope. Scale bar: 20 μm. (C) Adipogenic differentiation of MSCs, as detected by oil red O staining. Scale bar: 20 μm. (D) Chondrogenesis differentiation of MSCs, as detected by Alcian Blue staining. Scale bar: 20 μm.

