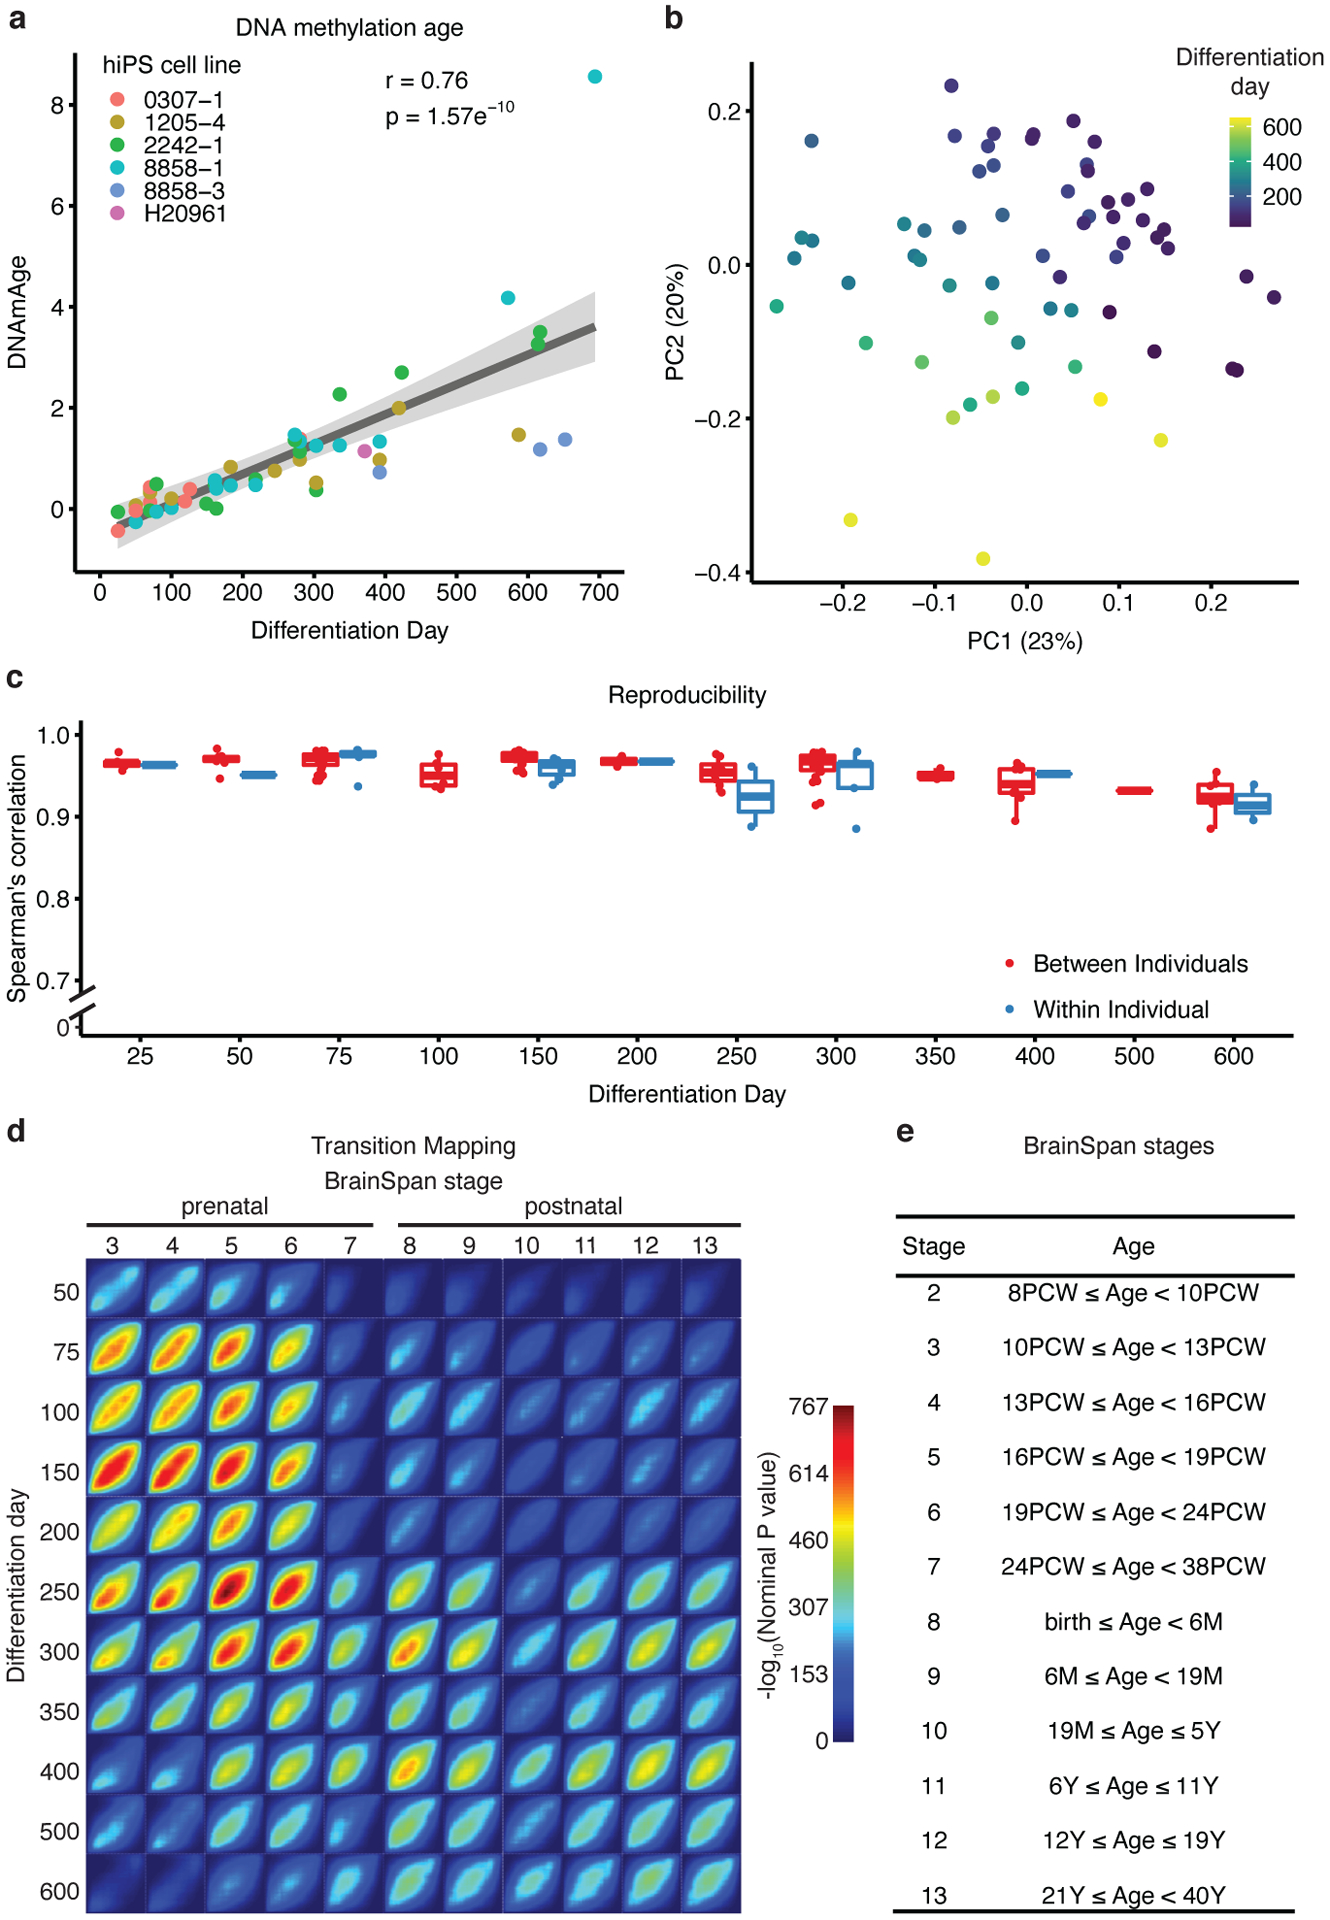
Figure 1. Methylation and transcriptional maturation in long-term hCS.

(a) The predicted methylation age (DNAmAge) of hCS is monotonically correlated with the in vitro differentiation day (r= +0.76, p = 1.57e−10, two-sided Pearson correlation test, n = 50 from 6 hiPSC lines derived from 5 individuals). Colors denote individual hiPSC lines. The shaded grey area represents the 95% confidence interval. (b) Scatter plot of the first two principal components (PC) of gene expression data. Color represents differentiation day and shape represents the hiPSC line. Numbers in brackets on axis titles are the percent of variance explained by the PC. (c) Spearman’s correlation of gene expression between samples from the same timepoint which were derived either from different individuals (red) or from the same individual (blue) (n = 62 samples from 6 hiPSC lines derived from 5 individuals).Boxplots show: center – median, lower hinge – 25% quantile, upper hinge – 75% quantile, lower whisker – smallest observation greater than or equal to lower hinge −1.5x interquartile range, upper whisker – largest observation less than or equal to upper hinge +1.5x interquartile range. (d) Transition mapping (TMAP) of gene expression of hCS (compared to differentiation day 25) and human primary tissue from the BrainSpan dataset (compared to stage 2). (e) BrainSpan stages and corresponding age. PCW – post conception weeks, M – months, Y – Years.
