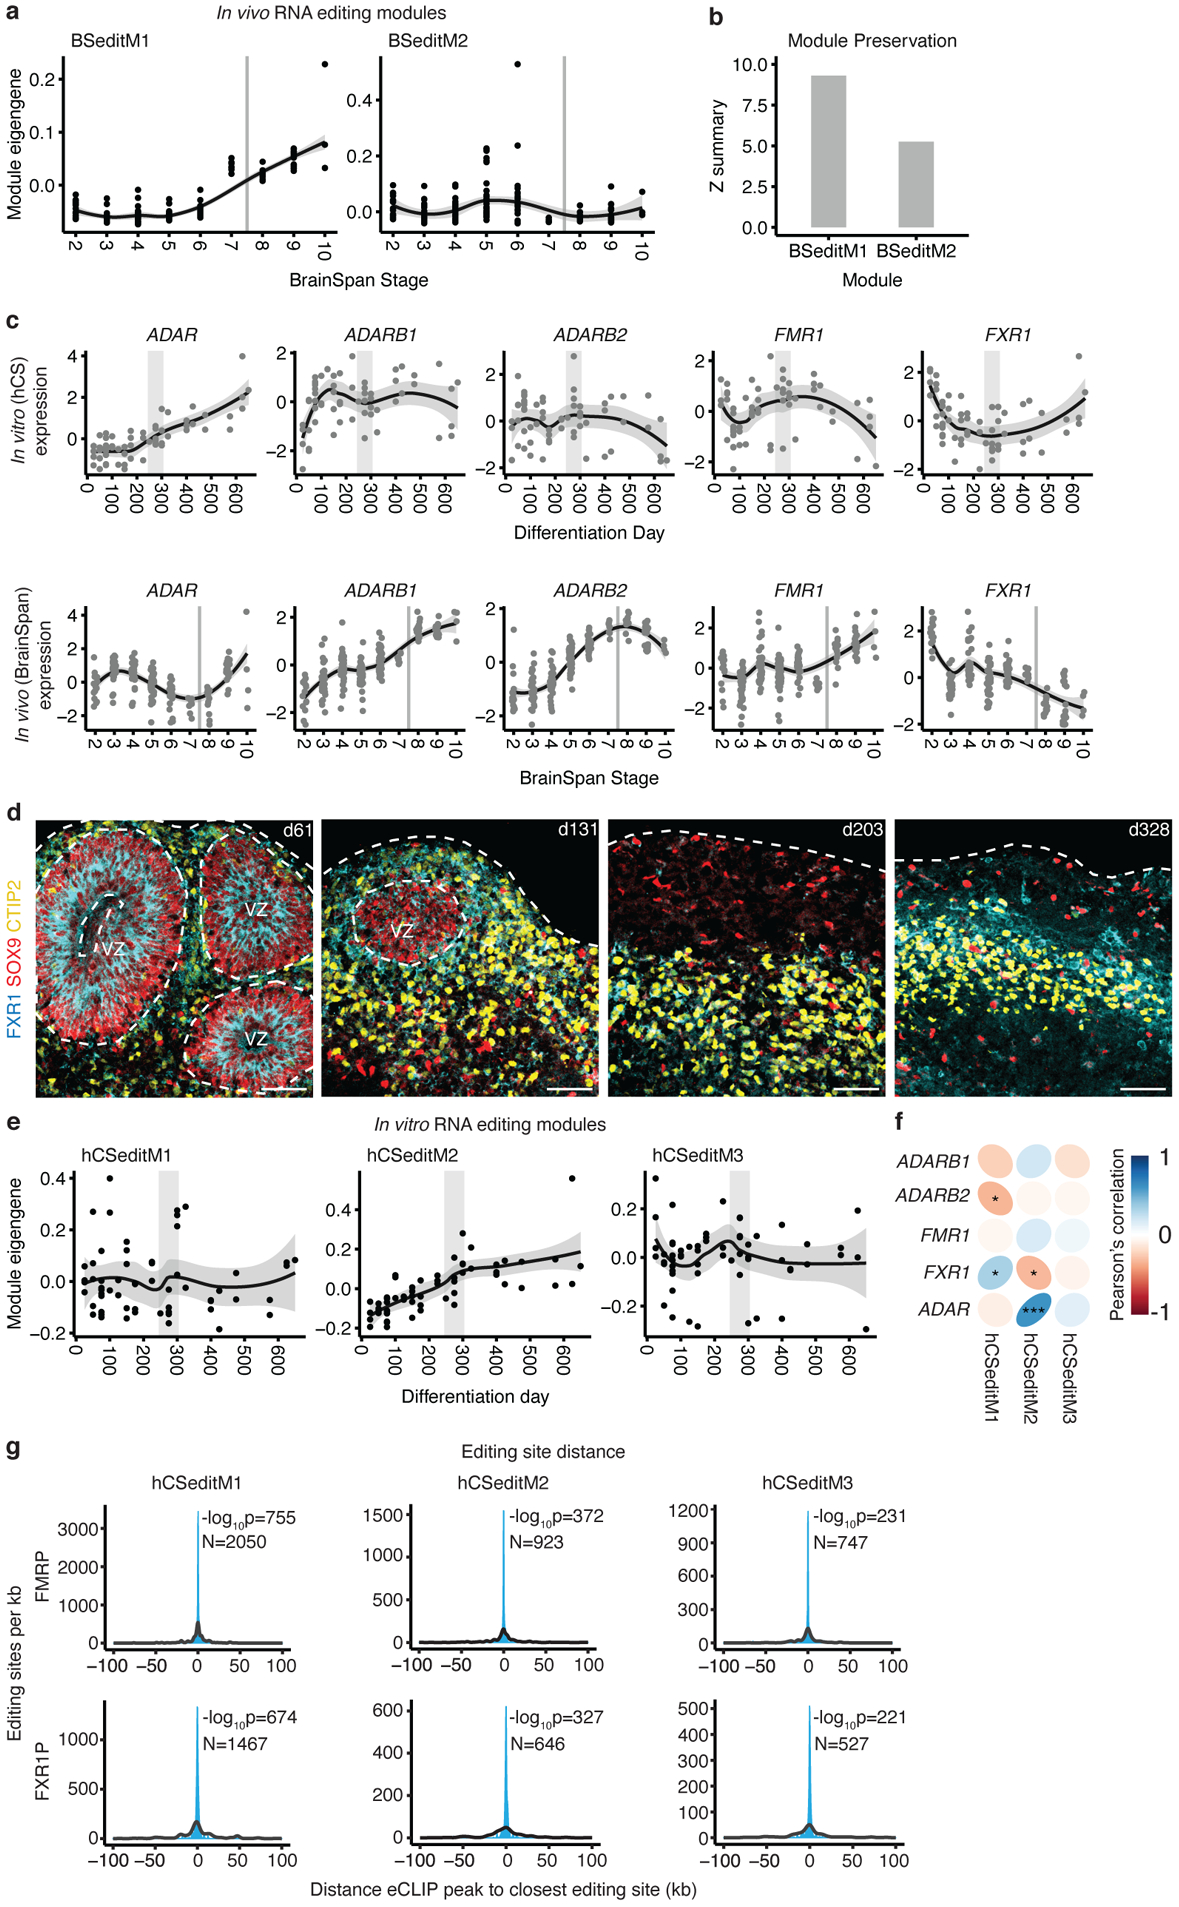
Figure 3. RNA editing in hCS.

(a) Trajectories of in vivo (BrainSpan) RNA editing modules. (b) Preservation scores (Z summary) of the in vivo RNA editing modules in hCS. (c) Trajectories of RNA editing enzymes in hCS (top) and in vivo from Brain Span (bottom). (d) Immunohistochemistry of the RNA editing regulator FXR1 with the glial and neuronal markers GFAP and CTIP2 (also known as BCL11B) at day 61 (d61; line 0524–1), at day 131 (d131; line 1205–4), at day 200 (d203; line1205–4), and at day 328 of differentiation (d328; line 2242–1). VZ - ventricular zone. Scale bars, 50 μm. Immunohistochemistry experiments were performed once for d61, twice for d131 and d203, and 3 times for d328 (1–3 hCS per line from at least 2 hiPSC lines were included) (e) Trajectories of the three hCS RNA editing modules. (f) Correlation of module eigenvalues with the expression of the major known RNA editing enzymes and regulators. (g) Distributions showing the closest distances between editing sites from hCS editing modules and FMRP or FXR1P eCLIP peaks (blue). The median of 10,000 sets of control sites (black) is depicted for comparison. See methods for details of permutation-based tow sided P-value calculation. N indicates the number of editing sites shown. *FDR, 0.05, ***FDR < 0.005. In (a), (c) and (e), the shaded grey area around the trajectory represents the 95% confidence interval, vertical grey lines represent birth and vertical grey bars denote the shift from prenatal to postnatal gene expression based on matching to in vivo patterns. In (c) top row and (e), n = 62 samples from 6 hiPSC lines derived from 5 individuals. In (a) and (c) bottom row, n = 196 from 24 individuals).
