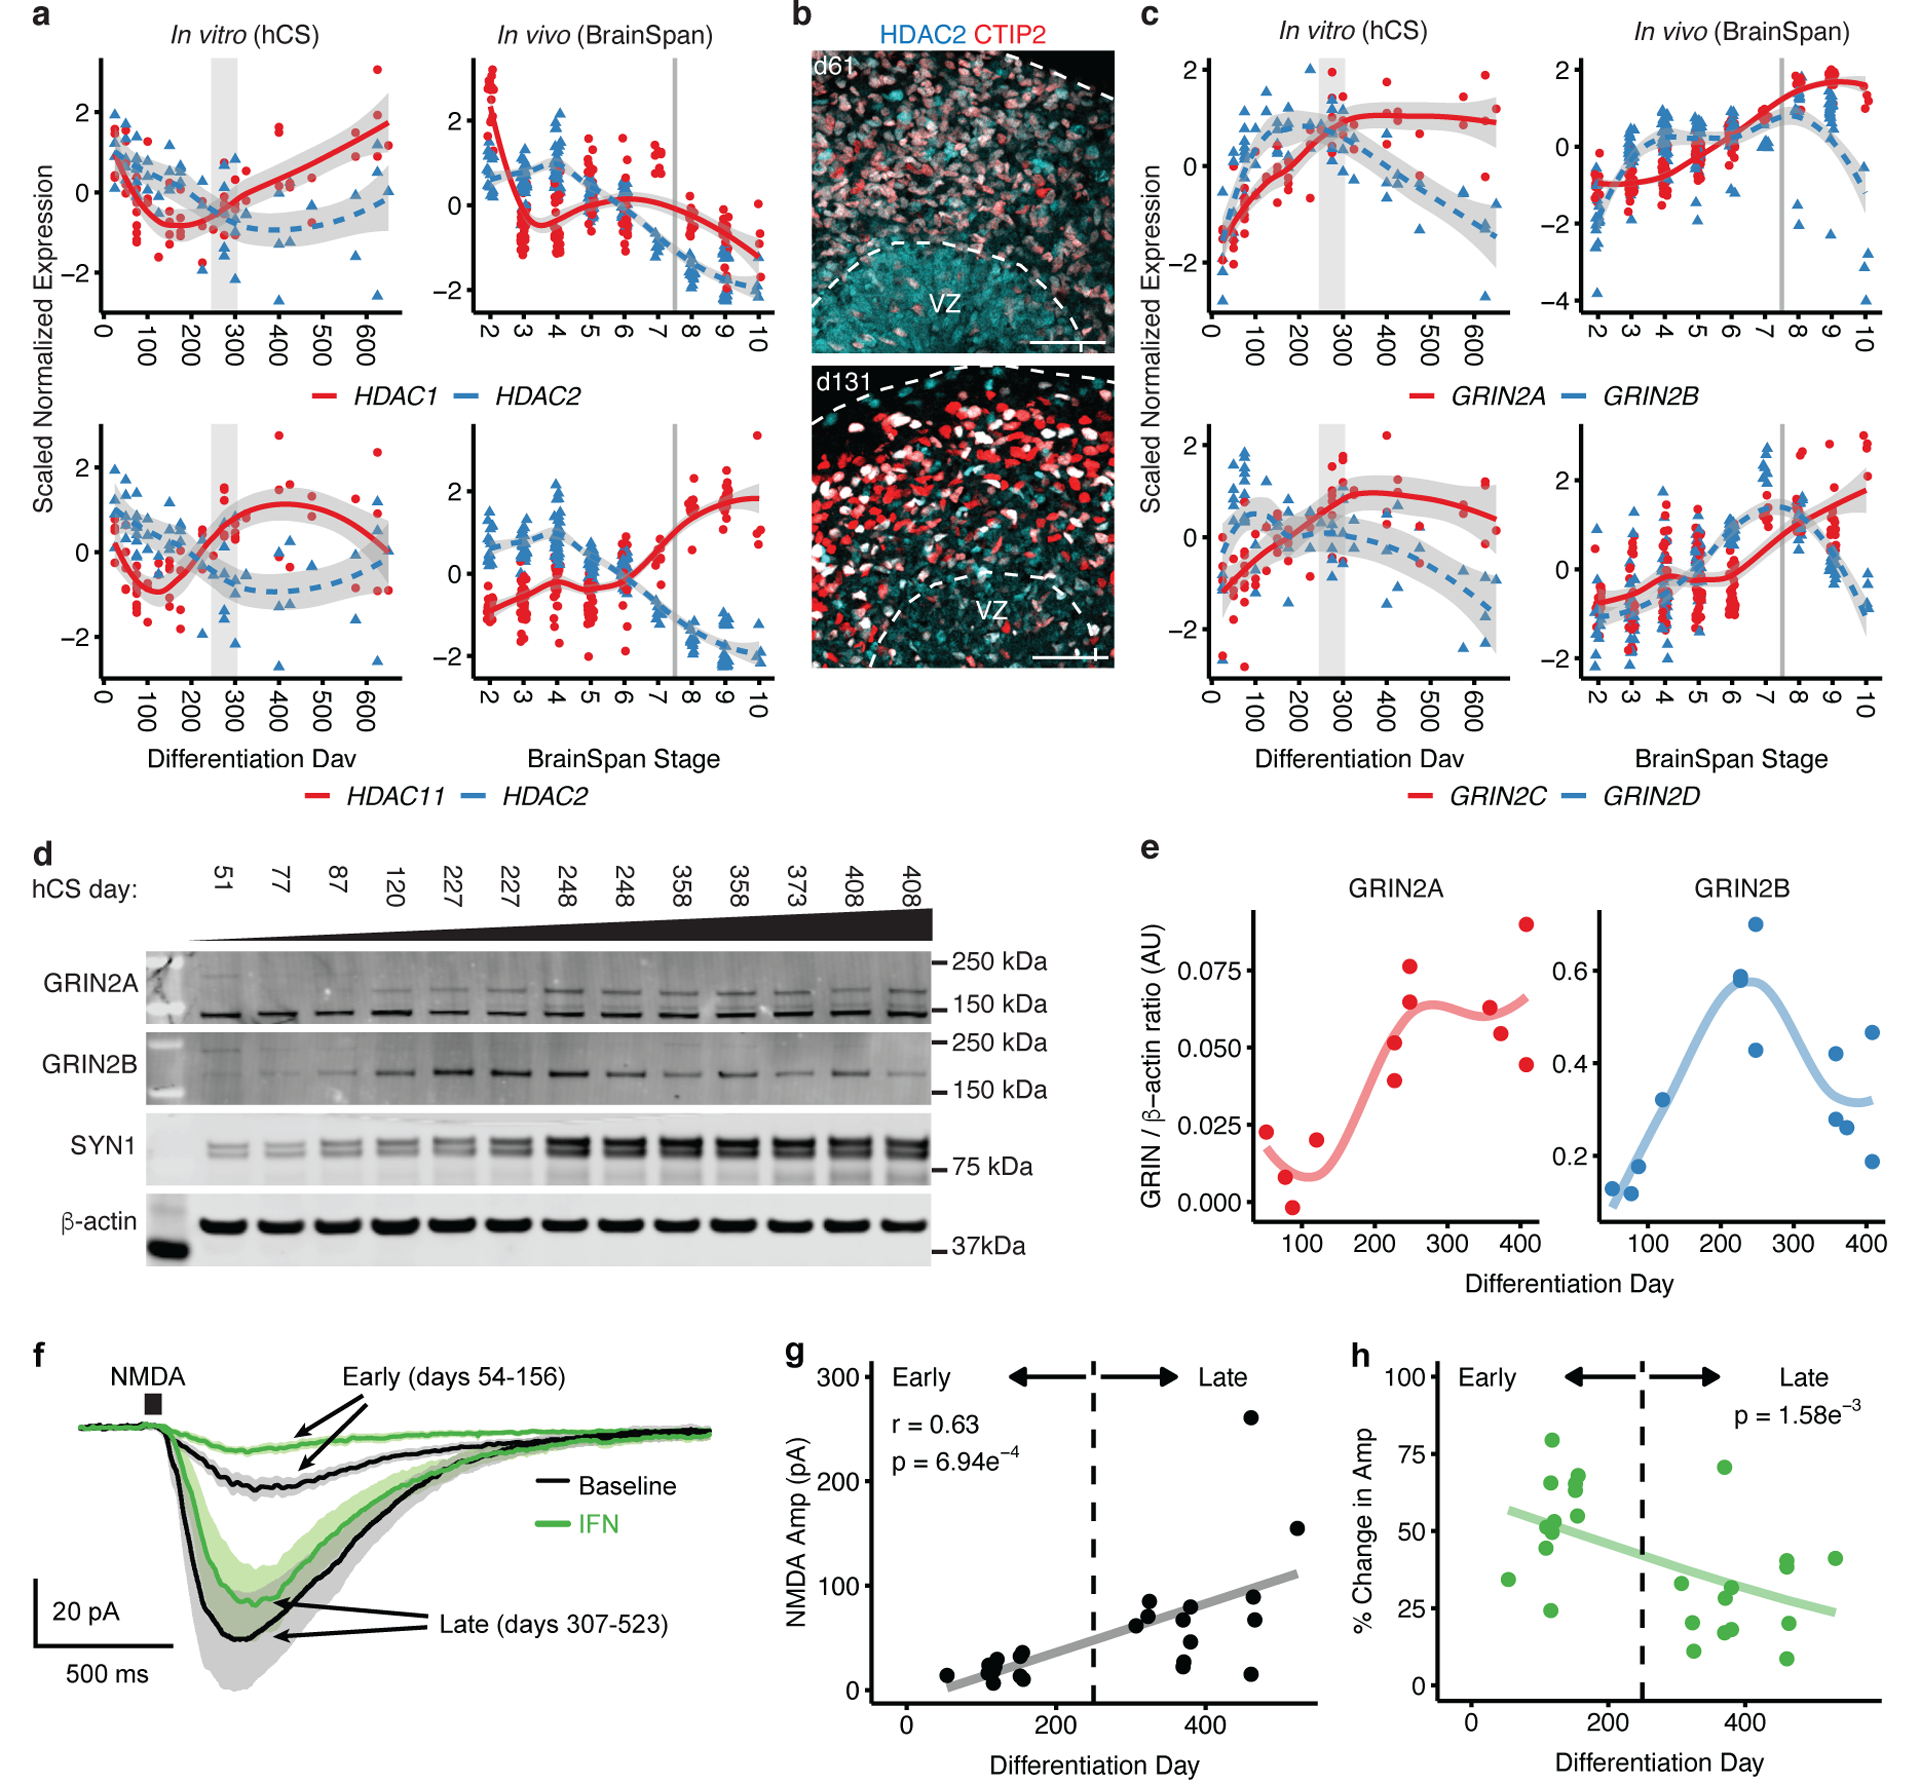
Figure 4. Developmental isoform switches in hCS.

(a) Expression trajectories of histone deacetylase (HDAC) subunits. In vivo (right) and in vitro (left), HDAC2 expression decreases while the expression of both HDAC1 (top) and HDAC11 (bottom) increases. The shaded grey area around the trajectory line represents the 95% confidence interval. (b) Immunohistochemistry for HDAC2 and deep layer marker CTIP2 (also known as BCL11B) at day 61 (d61; line 0524–1) and day 131 (d131; line 1205–4). VZ, ventricular zone. Scale bars, 50 μm. Immunohistochemistry experiments were performed once for d61 or twice for d131 (1–3 hCS per line from at least 2 hiPSC lines were included). (c) Expression trajectories of NMDA receptor subunits. In vivo (right) and in vitro (left), GRIN2A (NR2A) and GRIN2B (NR2B) (top), as well as GRIN2C (NR2C) and GRIN2D (NR2D) (bottom). In (a) and (c), the shaded grey area around the trajectory represents the 95% confidence interval, vertical grey lines represent birth and vertical grey bars denote the shift from prenatal to postnatal gene expression based on matching to in vivo patterns. For in vitro data, n = 62 samples from 6 hiPSC lines derived from 5 individuals; for in vivo data, n = 196 from 24 individuals. (d) Western blots for GRIN2A, GRIN2B, Synpsin-1. β-actin was used as a loading control. The images shown were cropped (uncropped images are included in Source Data 1). Cell lines used are 1205–4 (samples 1, 2, 3, 4, 6, 8, 10, 11 and 13) and 0524–1 (samples 5, 7, 9 and 12). Western blot experiments were run 3 times with similar results. (e) Quantification of GRIN2A and GRIN2B protein levels from (d) (n = 13 from 2 hiPSC lines). (f) Average whole-cell voltage clamp recordings of NMDA responses (10 mM NMDA, 50 ms pulse) at early (red, days 54–156) and late (black, days 307–523) stages of hCS development. Standard error of the mean (SEM) are depicted by the grey and pink lines. Neurons were identified with a fluorescent reporter (Syn1::GFP). (g) Increased maximum NMDA response amplitudes over developmental time (r = 0.63, p = 6.94e−4). Black line represents the linear fit of the data. (h) Percent reduction of maximum NMDA responses by the NR2B-containing NMDA receptor blocker ifenprodil (IFN, 10 μM) is significantly reduced with time. Significance was measured using a beta regression with logit link function, B = −0.003, p = 1.58e−3. One cell was patched per hCS for a total of 25 cells from two hiPSC lines (8858–1, 1205–4).
