
Figure 6. Mapping neurodegenerative disorder genes onto hCS differentiation.
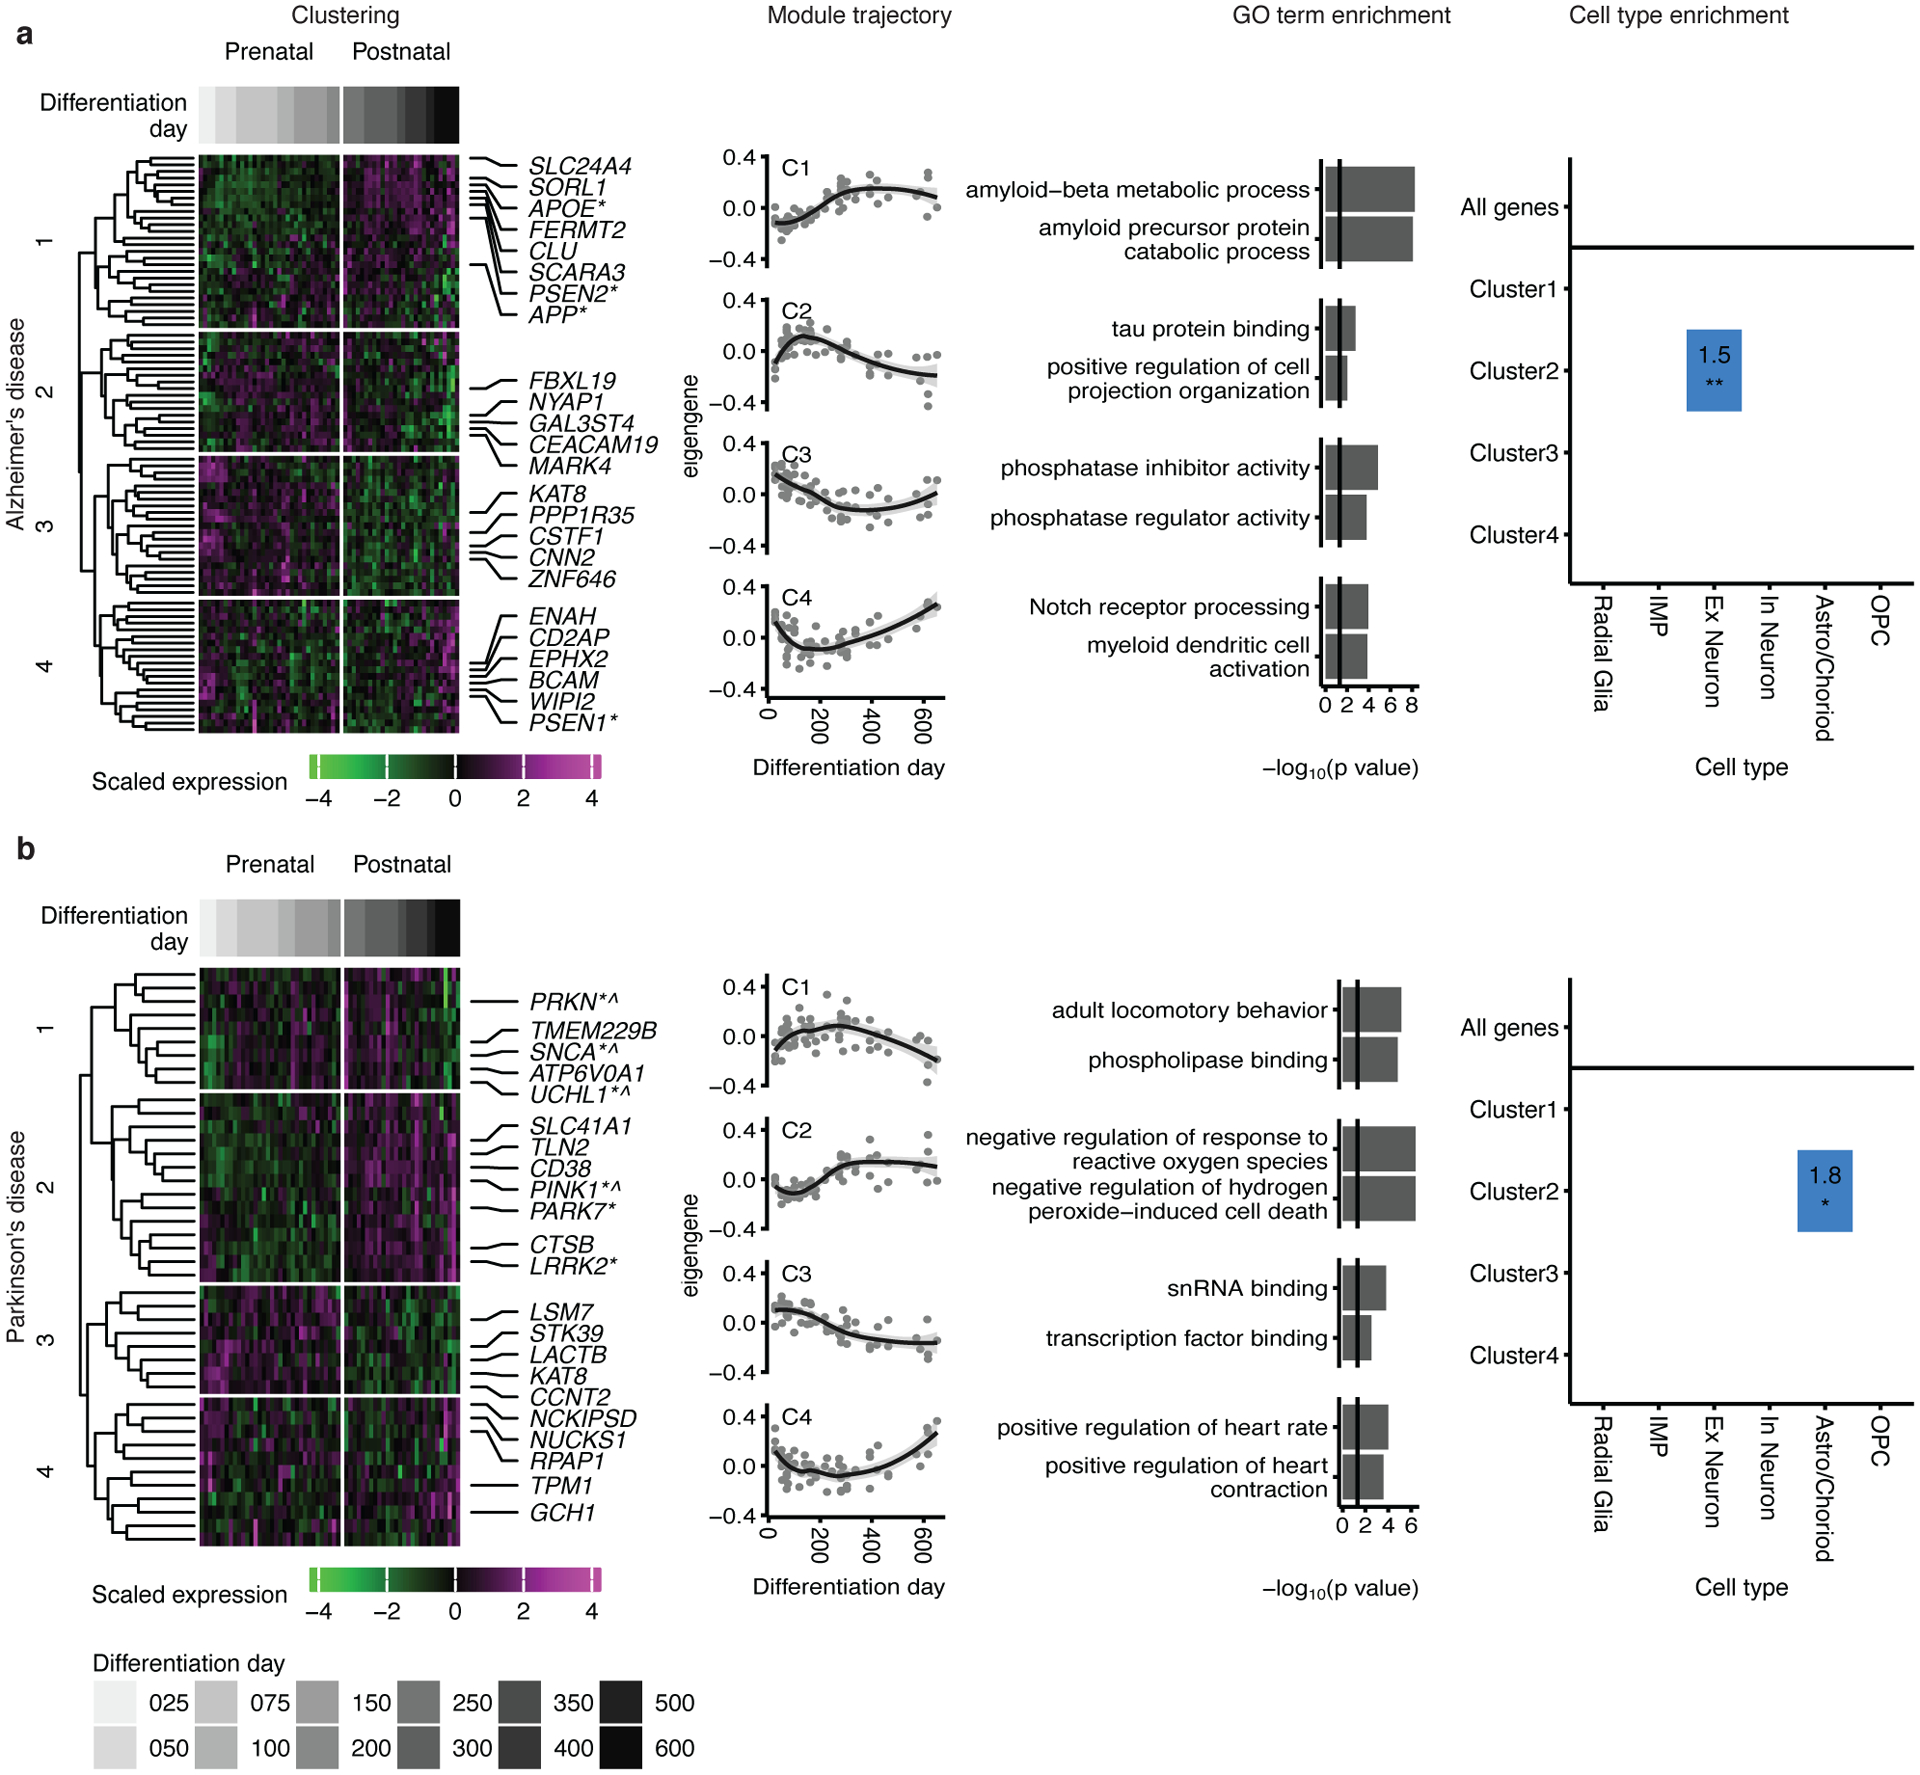
Mapping of genes associated with Alzheimer’s disease (a) and Parkinson’s disease (b) onto hCS differentiation. The first column shows clustering of scaled normalized expression of genes associated with a disorder. Genes (in rows) are clustered using hierarchical clustering on the Euclidean distance between genes. Samples (columns) are ordered by differentiation day (represented by gray bars) with the earliest days on the left and latest time points on the right. The 5 most representative genes (highest correlation with the cluster eigengene) and genes associated with familial forms of the disease are shown. *, Familial gene; ^, Familial gene that is also a hub gene. The second column is the cluster eigengenes (first principal component) for the identified gene clusters. The shaded grey area around the trajectory line represents the 95% confidence interval. The third column is the top GO-terms enriched in the identified clusters. The fourth column is cell types over expressed in either all the genes associated with a disorder (above line) or in the genes from the identified clusters. Number and color represent the fold change. Significance was tested using a one-sided permutation test with 100,000 permutations. P values were corrected for multiple testing using the Benjamini-Hochberg method. * FDR < 0.05, ** FDR < 0.01, *** FDR < 0.005. n = 62 samples from 6 hiPSC lines derived from 5 individuals.