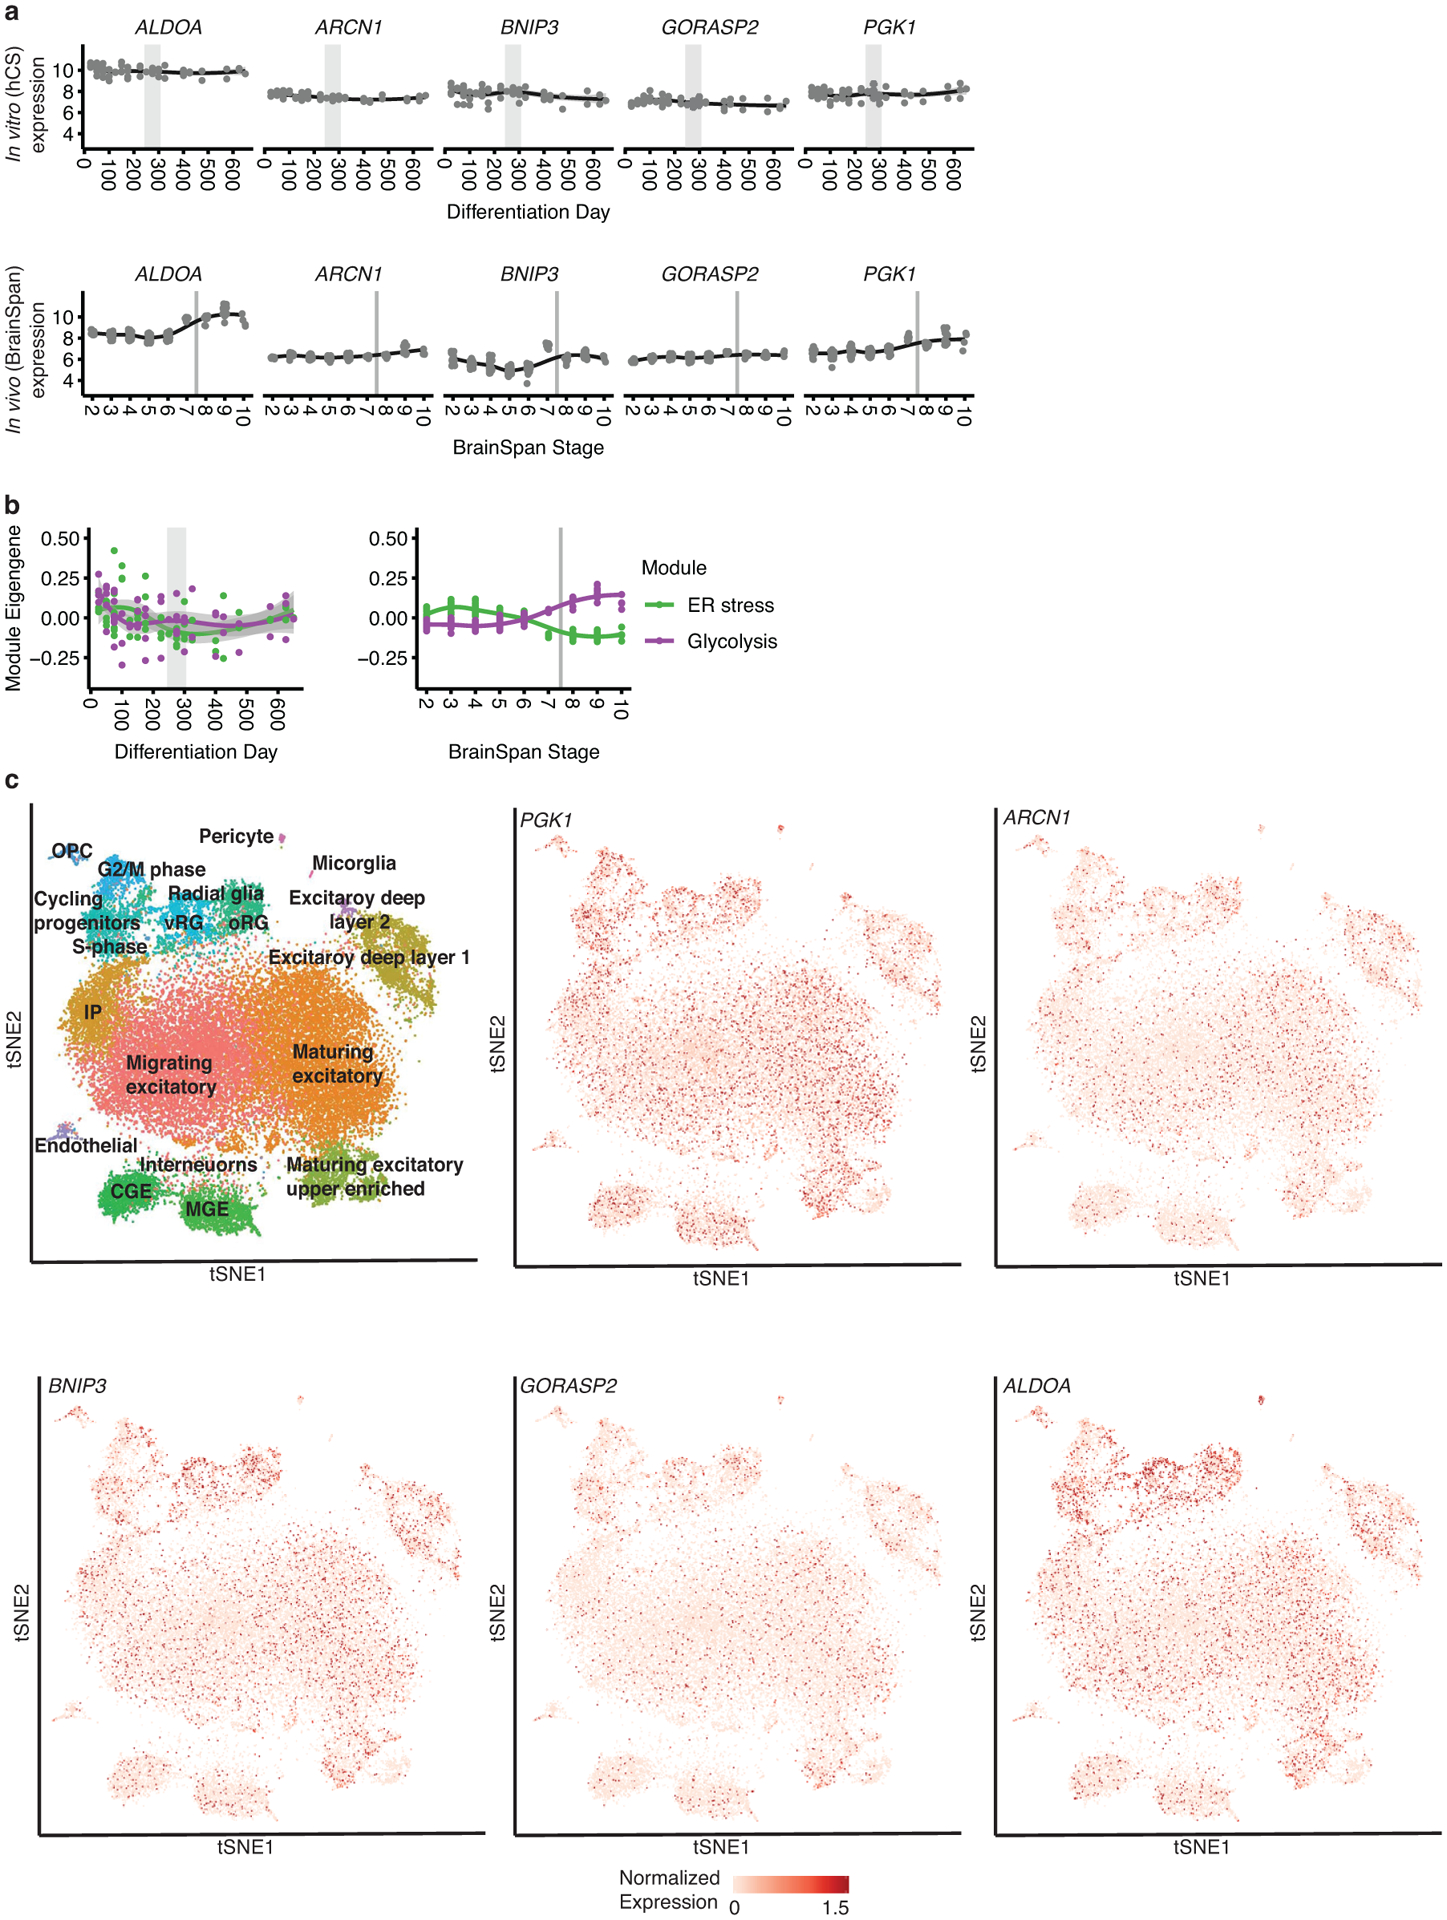
Extended Data Fig. 2. Cell stress in hCS.

(a) Trajectories of metabolic cell stress genes20 hCS (left) and in vivo (right). (b) In vitro and in vivo module eigen genes of glycolysis (organoid.Sloan.human.ME.paleturquoise) and ER stress (organoid.human.ME.darkred) previously suggested to be upregulated in vitro20. Grey areas denote time of shift from prenatal to postnatal gene expression. In (a) and (b) shaded grey area around the trajectory represents the 95% confidence interval, vertical grey lines represent birth and vertical grey bars denote the shift from prenatal to postnatal gene expression based on matching to in vivo patterns. For in vitro data n = 62 samples from 6 hiPSC lines derived from 5 individuals and for in vivo data n = 196 from 24 individuals. (c) Scatterplot visualization of cells in in developing fetal cortex colored by major cell types22. vRG, ventral radial glia; oRG, outer radial glia; CGE, caudal ganglionic eminence; MGE, medial ganglionic eminence; OPC, oligodendrocyte precursor cell; IP, intermediate progenitors.
