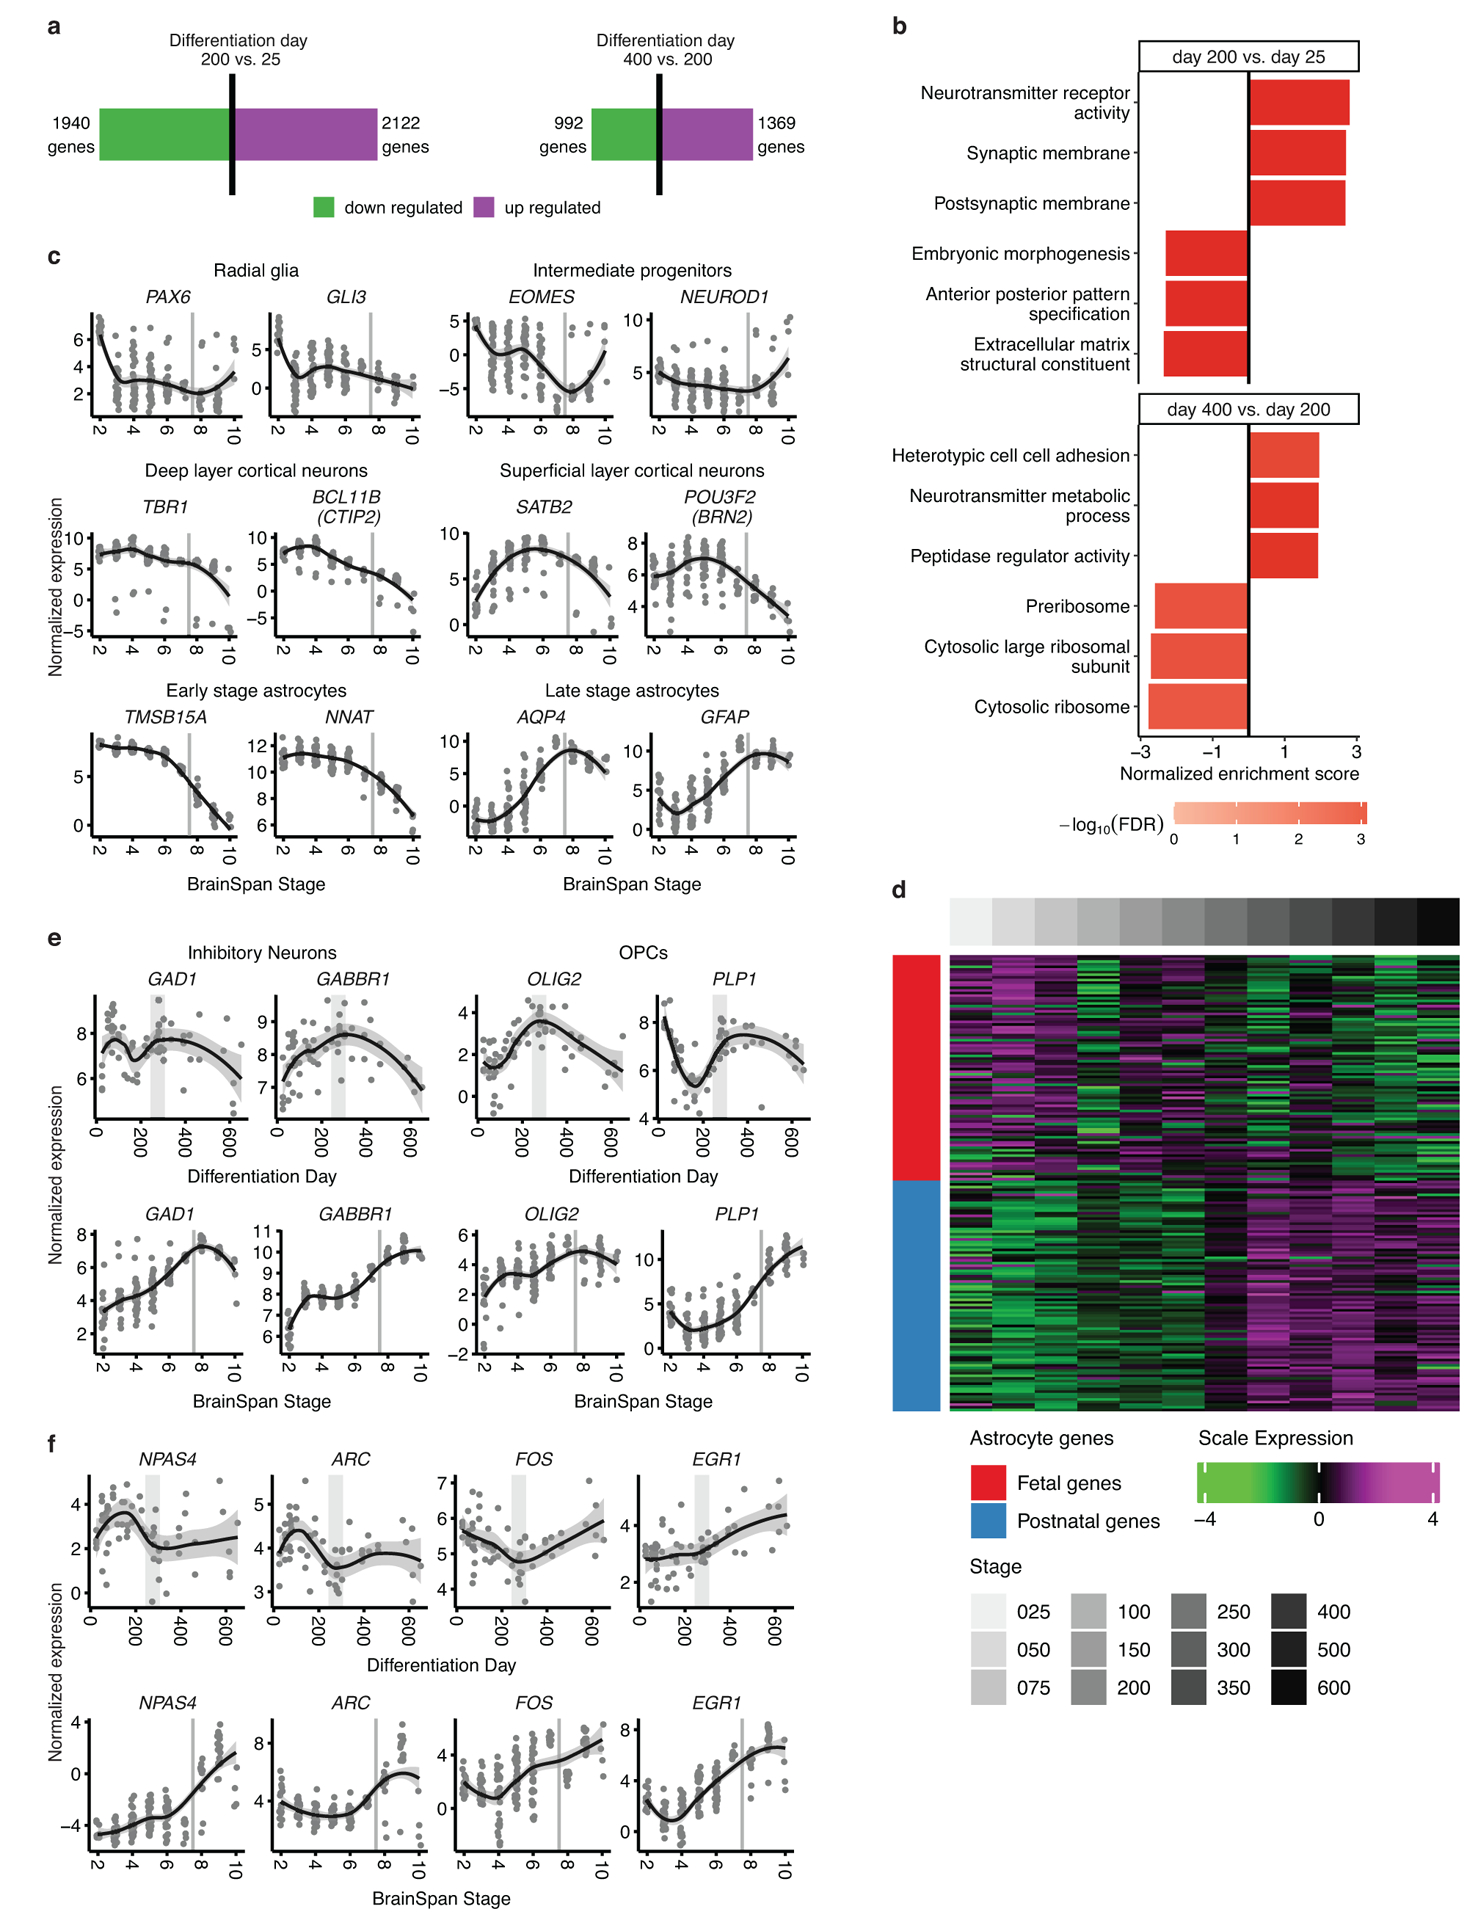
Extended Data Fig. 3. Changes in biological processes between early and later stages of differentiation.

(a) Number of differentially expressed genes when comparing differentiation day 200 to differentiation day 25 (left) and differentiation day 400 to differentiation day 200 (right). Red bar represents up-regulated genes and the green bar represents down-regulated genes. (b) Top 3 up- and downregulated GO terms enriched in genes ranked by logFC using gene set enrichment analysis, (GSEA; FDR < 0.05). (c) Normalized expression of marker genes in vivo for neurons, intermediate progenitors, astrocytes, and radial glia as well as upper and deep layer cortical neurons. (d) Scaled expression of fetal and mature astroglial genes7 during differentiation. A shift between fetal and mature gene sets occurs at ~250 days of hCS differentiation. (e) Normalized expression of marker genes for inhibitory neurons and oligodendrocyte precursor cells (OPCs) that are not preserved in hCS. (f) Normalized expression of activity dependent genes that are not preserved in hCS. In (c), (e) and (f) shaded grey area around the trajectory represents the 95% confidence interval, vertical grey lines represent birth and vertical grey bars denote the shift from prenatal to postnatal gene expression based on matching to in vivo patterns. For in vitro data n = 62 samples from 6 hiPSC lines derived from 5 individuals and for in vivo data n = 196 from 24 individuals.
