
Figure 3.
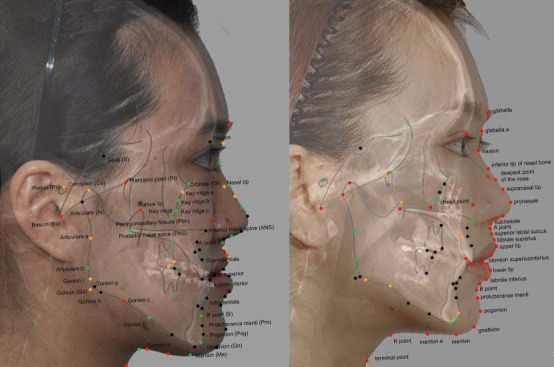
Selected landmark coordinates that were used in the SPLS with eta = 0.99. Selected x coordinates are indicated as orange dots; selected y coordinates are indicated as green dots; and selected landmarks (x and y coordinates) are indicated as red dots. Left: preoperative image with hard tissue landmarks in capital letters; right: postoperative image with soft tissue landmarks in lowercase letters.