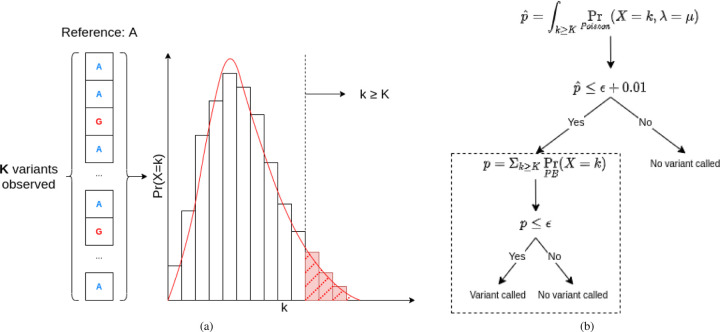
Fig. 1: The continuous Poisson approximation (red line) to the Poisson binomial (bars) distribution.
(a): The test statistic for the Poisson approximation is the right tail integral (shaded) and for the Poisson binomial it is the right tail sum (red bars). (b): The workflow of the improved LoFreq algorithm. The original LoFreq workflow is denoted by the dotted box. Here PrPB denotes probability under the Poisson-Binomial distribution. We first compute the tail integral over the Poisson distribution to get an approximate p-value we denote as . If , then we have high confidence that p > ϵ and therefore we do not call a variant.

